Latest exchange-rate chart
US Dollar by Country
Compare changes in the quoted US dollar rate against each country's own starting point. This page displays RavenInvestor's most recently uploaded chart.
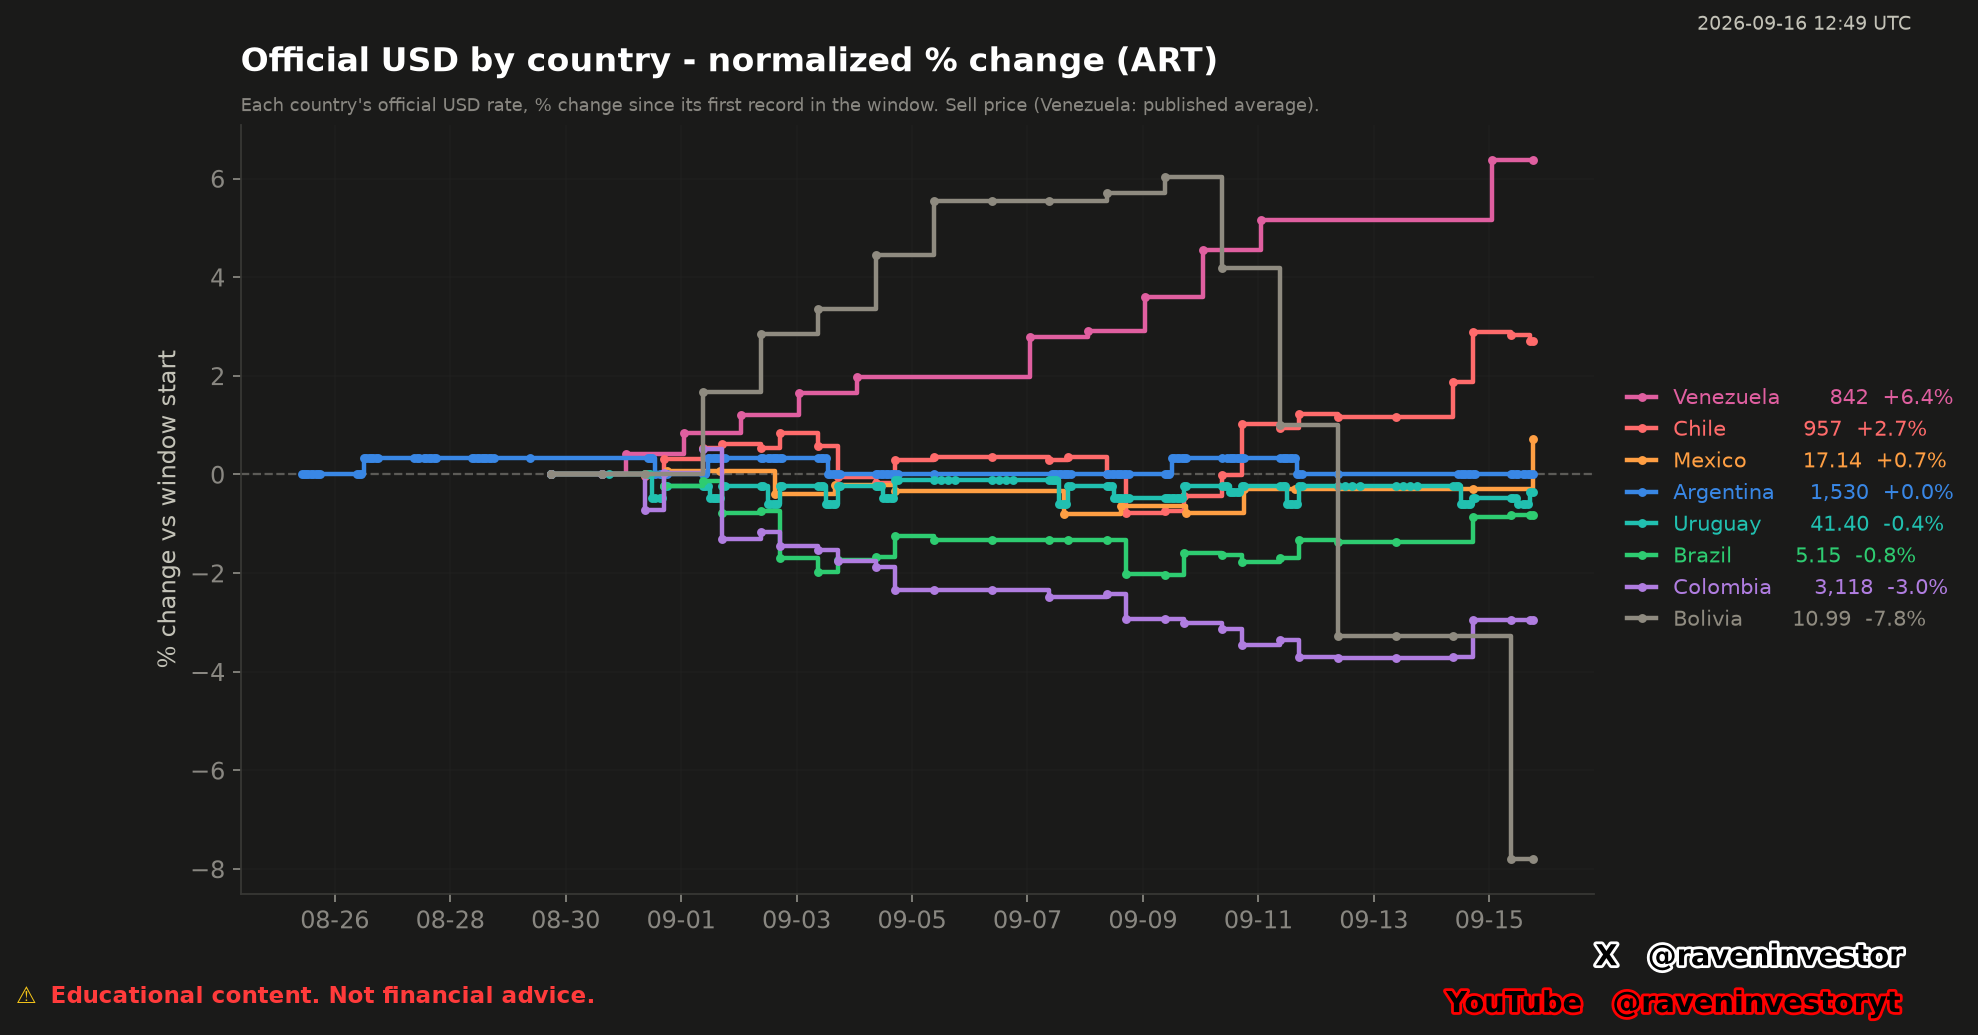
The date above is the server file-modification time. Refer to the timestamp inside the chart for its publication reference.
Open the full-size chart in a new tabReading the chart
Relative change from each starting point
The vertical axis shows the percentage change in each country's quoted dollar rate since its first available record in the displayed window. The dashed zero line marks that reference value.
Above zero, the quoted rate is higher than its starting value; below zero, it is lower. Because the rates are expressed in local currency per US dollar, an increase means more local currency units per dollar in that quote.
- Each color identifies a country. Colors are not buy or sell signals.
- The legend pairs each country with its latest displayed quote and its relative percentage change.
- The stepped lines connect recorded values. Flat segments do not establish that no market movement occurred between records.
Sources and time references
Read the timestamps in their own time zones
The chart is published by RavenInvestor. Its horizontal time axis uses ART, while the timestamp printed in the upper corner is labeled UTC. Keep these references separate when reading dates.
The file-update time above the image describes the file on this website's server. It does not establish when every underlying exchange rate was observed or published. The image does not name its upstream data providers, so this page does not attribute the quotes to a particular agency or exchange.
Update policy
One current image, updated on upload
RavenInvestor replaces the image when a new chart is ready. This page keeps only the latest available version and has no historical archive. Reload the page to check for a newer upload; the chart is not a real-time feed.
The chart describes the published observations and does not forecast exchange rates or guarantee the terms of a currency transaction. It is general financial information, not personalized financial advice.