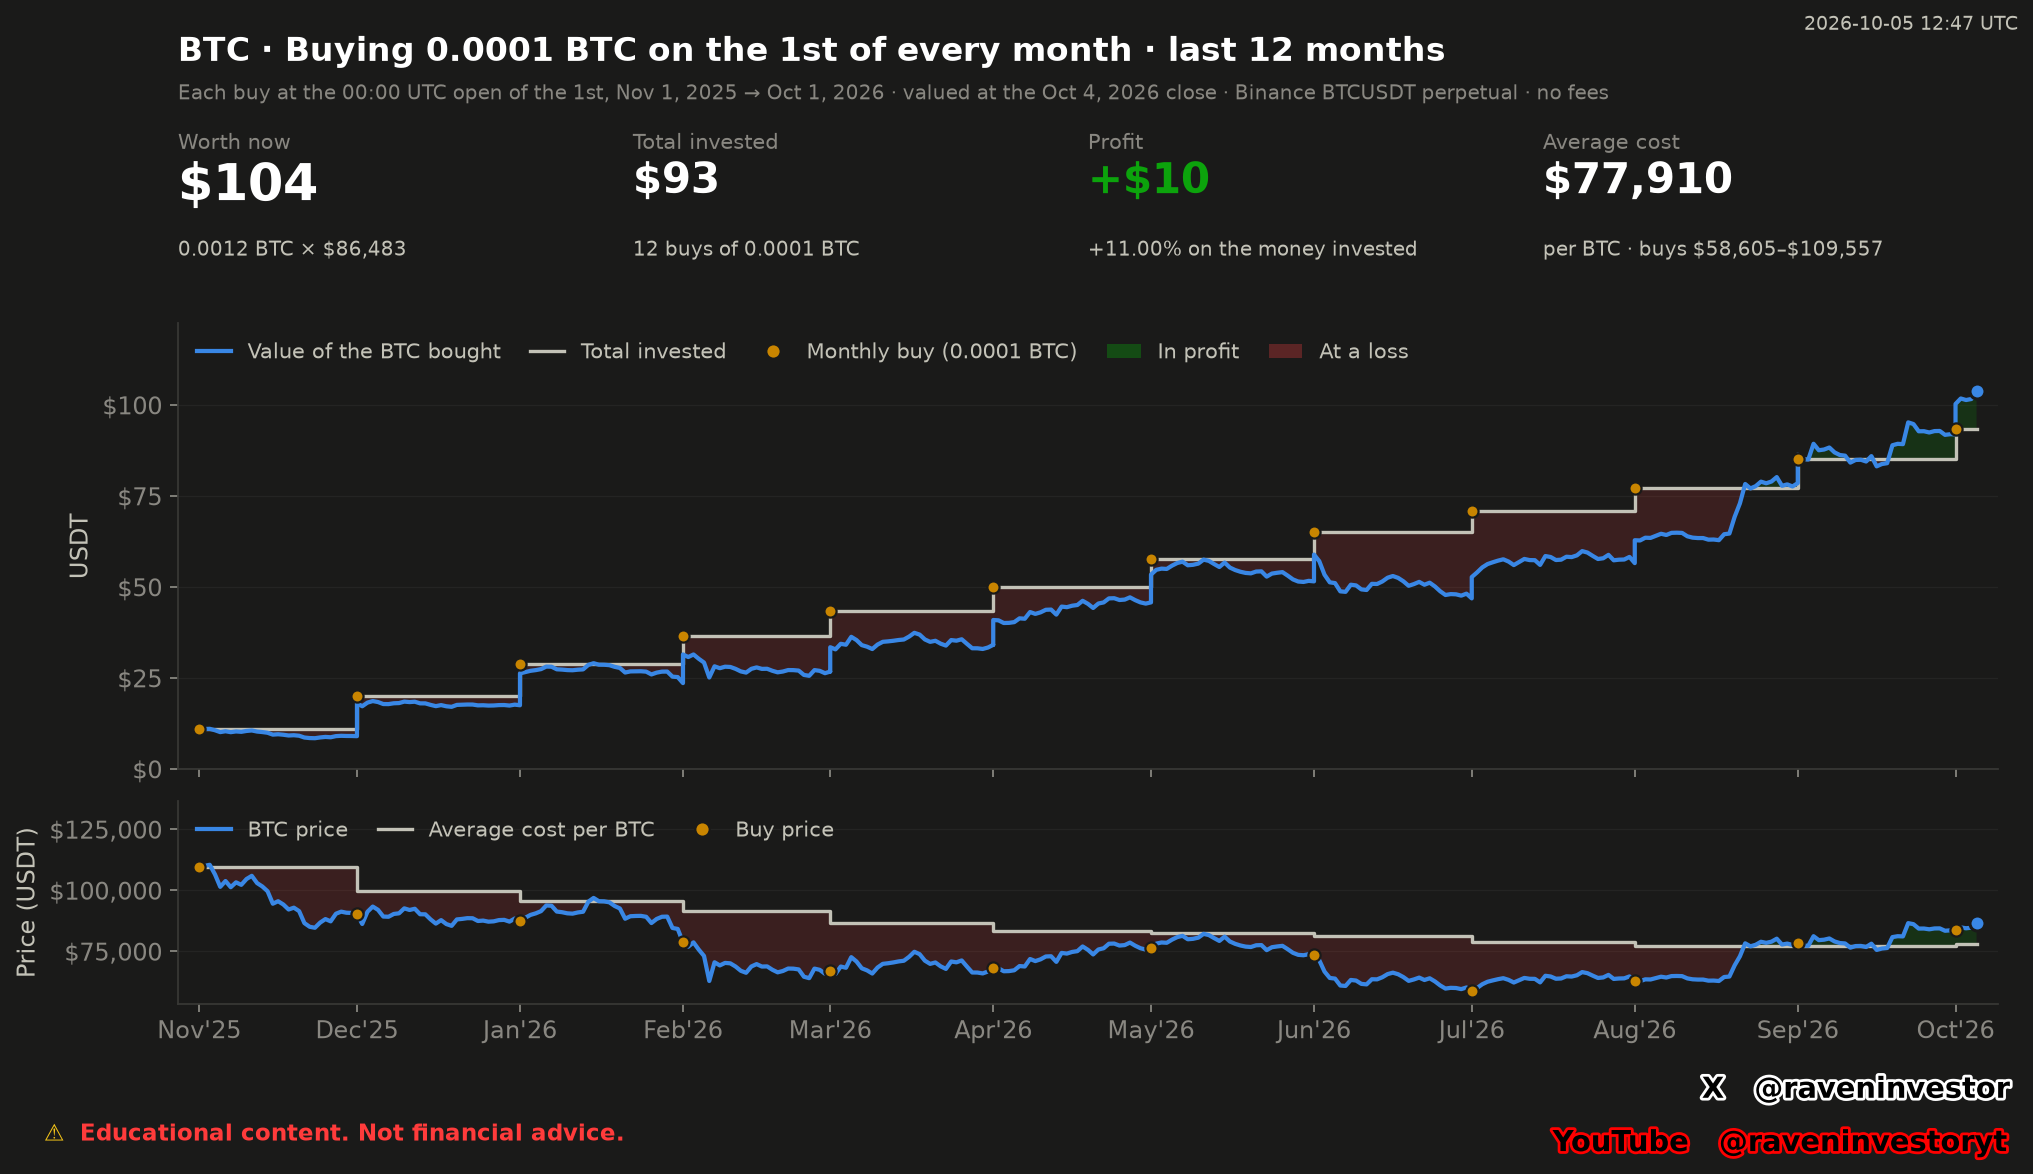
Buying 0.0001 BTC at each monthly opening accumulated 0.0012 BTC at a reported cost of 93.49 USDT. The simulated value was 103.78 USDT at the October 4 close, but the positive endpoint does not describe the losses along the way.
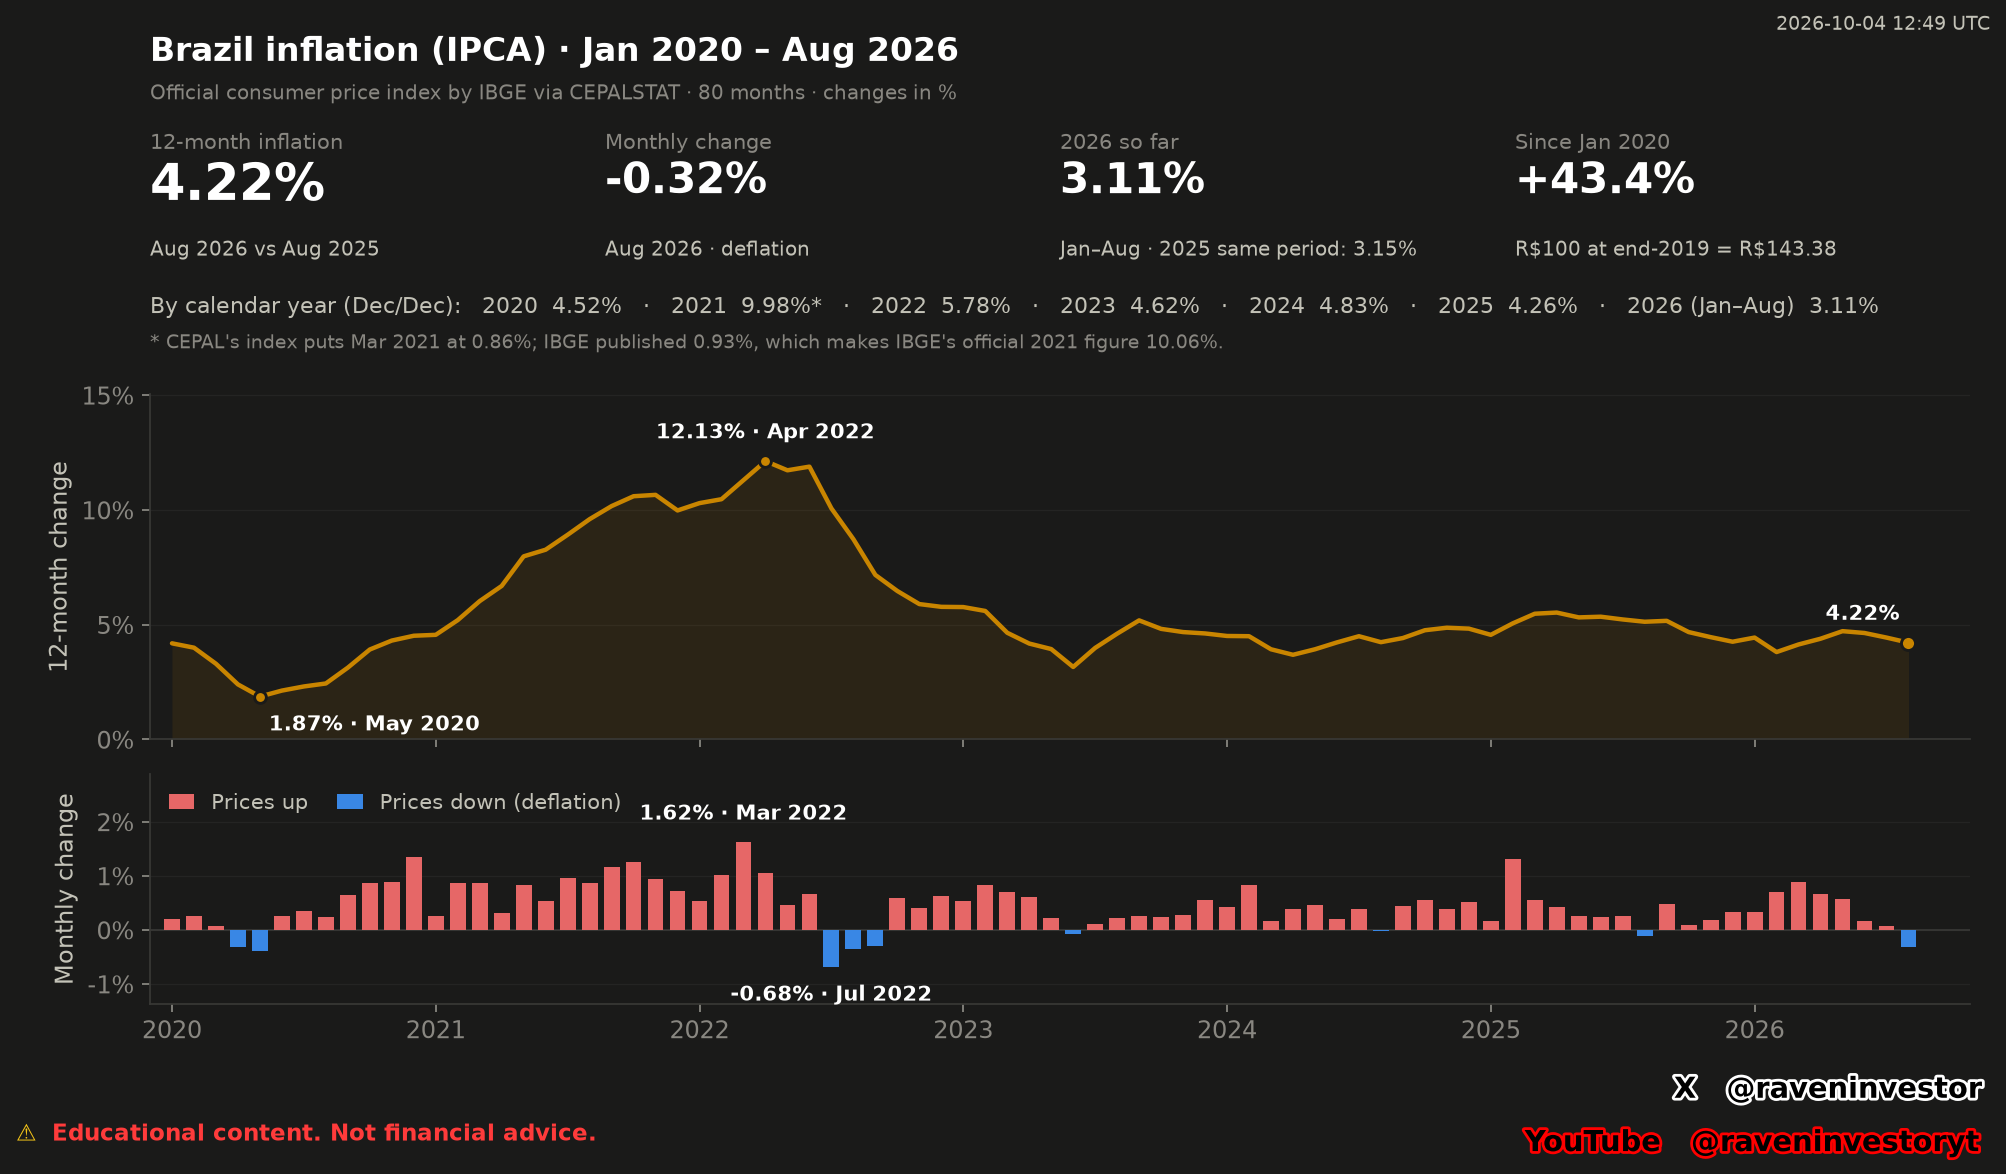
The 80-month IPCA series records a monthly decline of 0.32% in August 2026, while its cumulative increase since the end of 2019 remains 43.38%. The latest movement and the accumulated price level answer different questions.
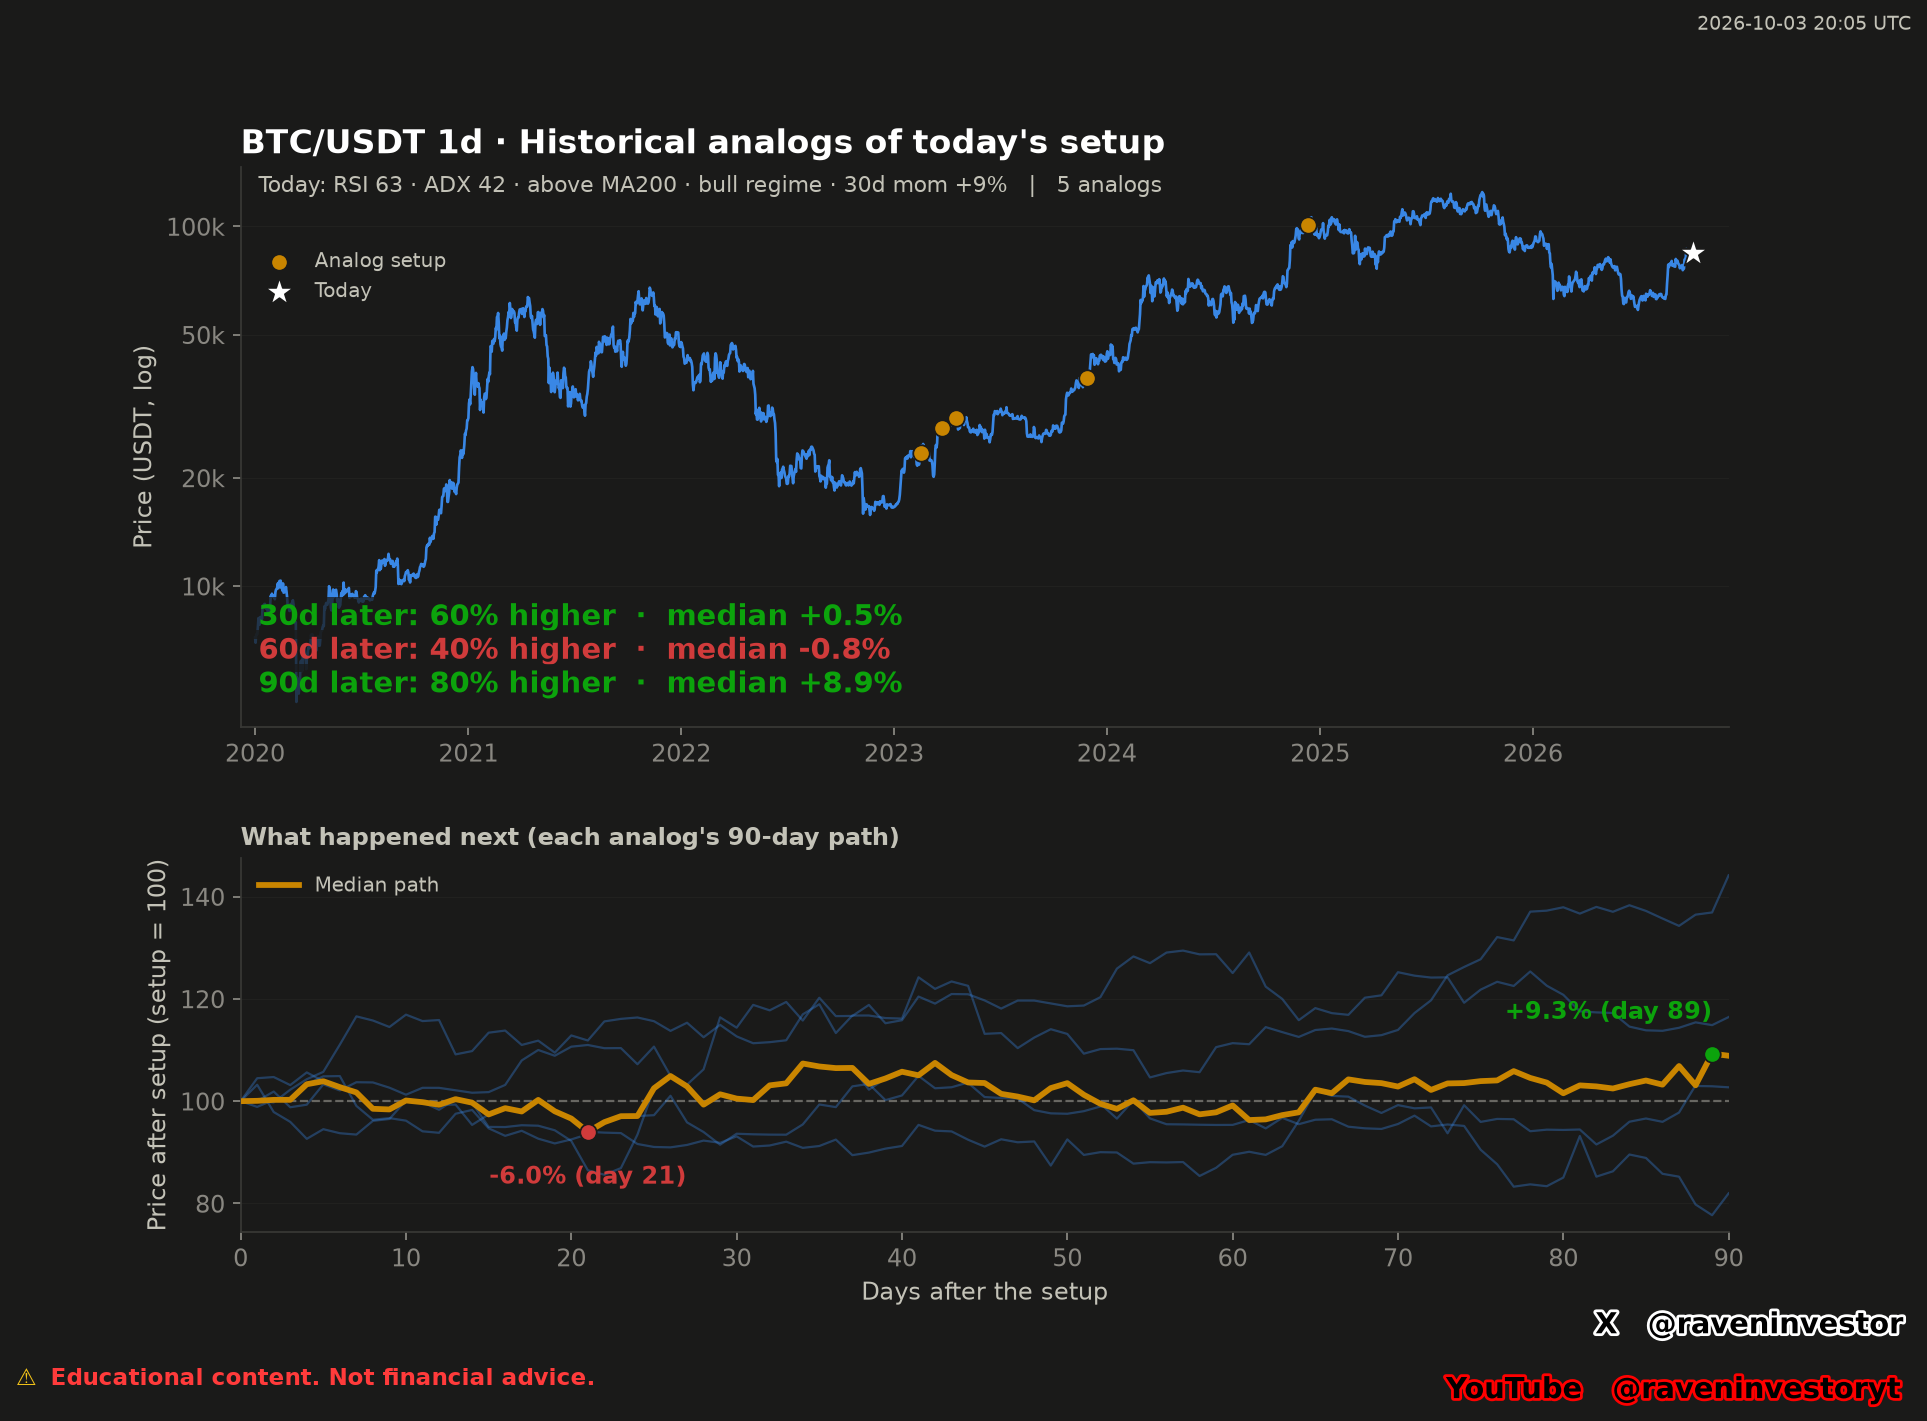
Among five matched episodes, three were higher after 30 days and four after 90 days. The medians were +0.5% and +8.9%, but the individual paths included losses: this is a small historical comparison, not a forecast.
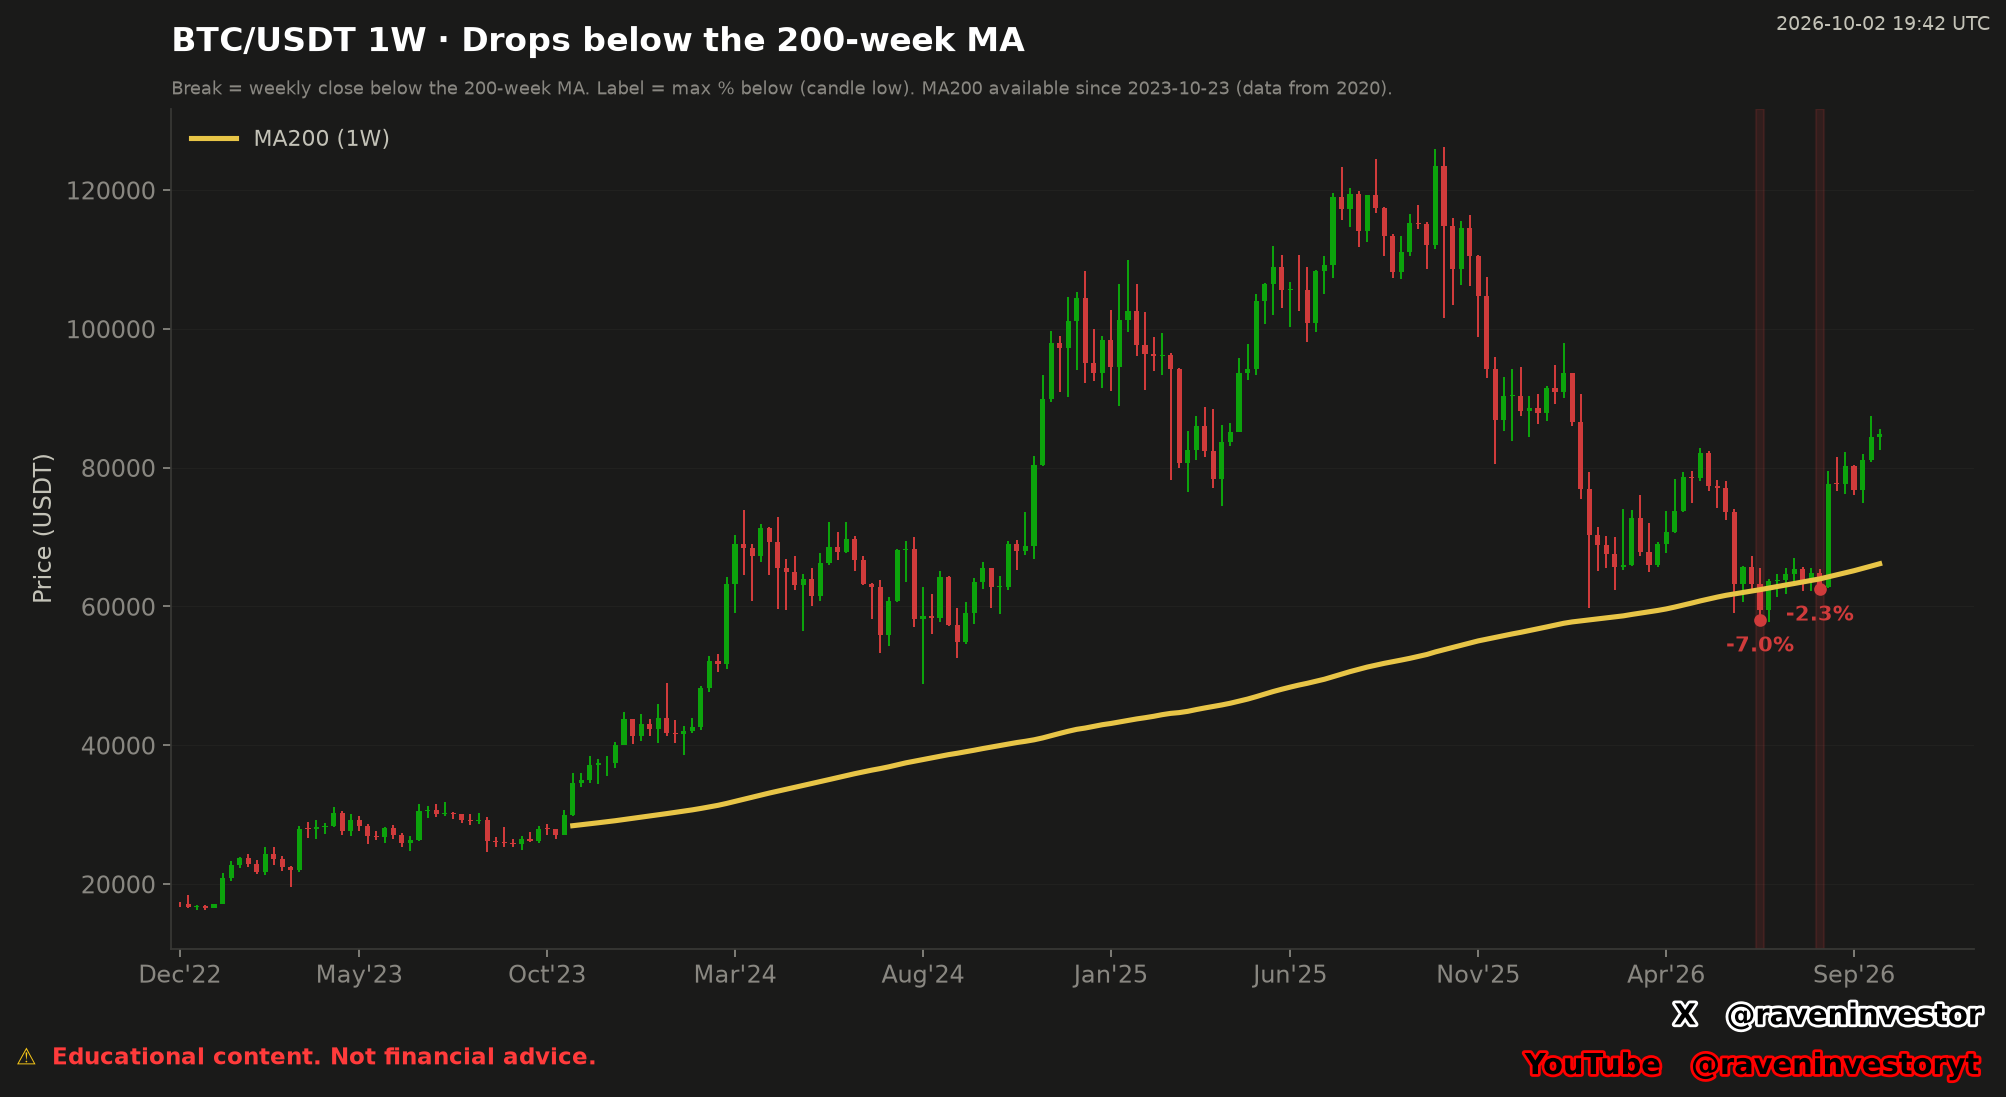
The supplied study identifies two weekly-close breaks below MA200, with maximum intraweek depths of -7.04% and -2.34%. Both lasted one qualifying week; neither result describes a future return.
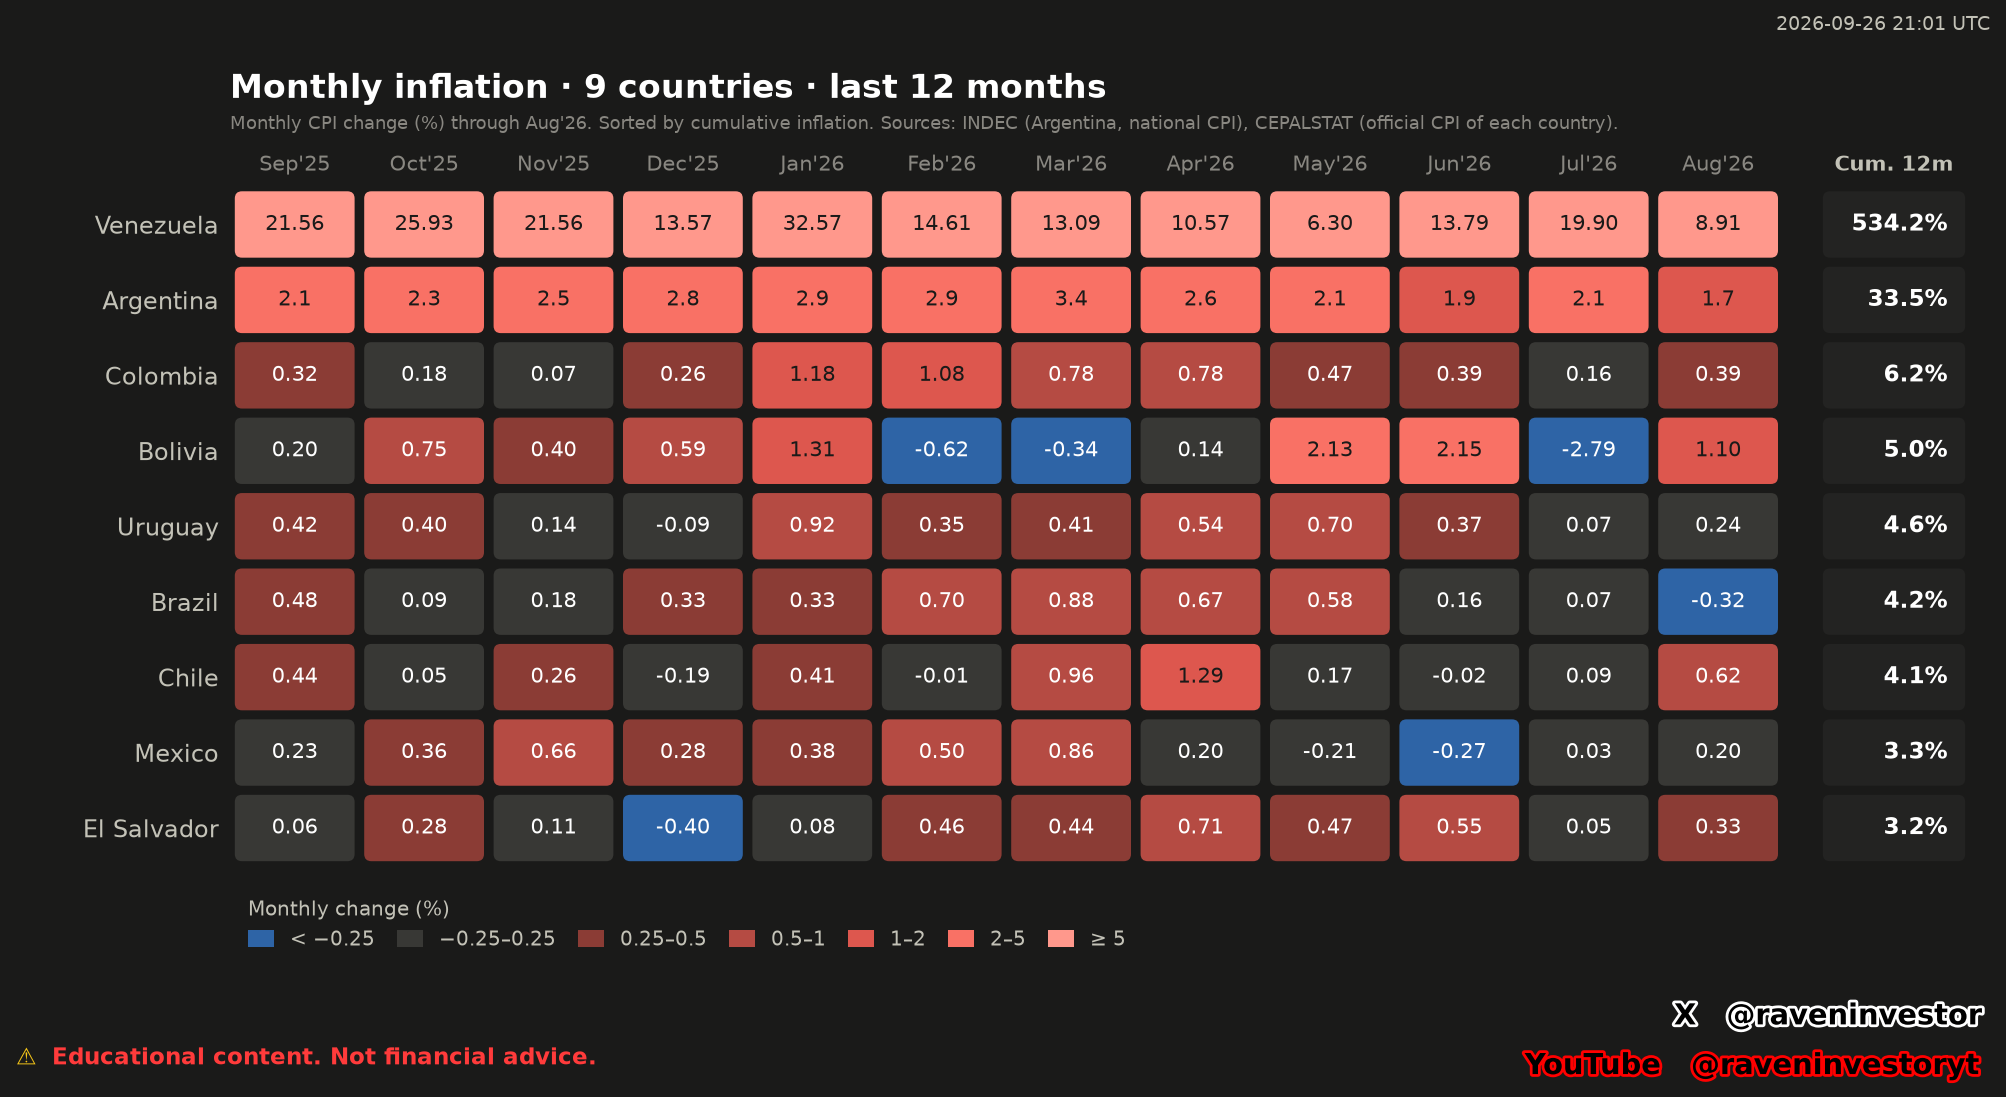
Venezuela leads cumulative inflation in the supplied 12-month sample, while seven countries remain below 10%. The recent monthly averages add a different perspective to that ranking.
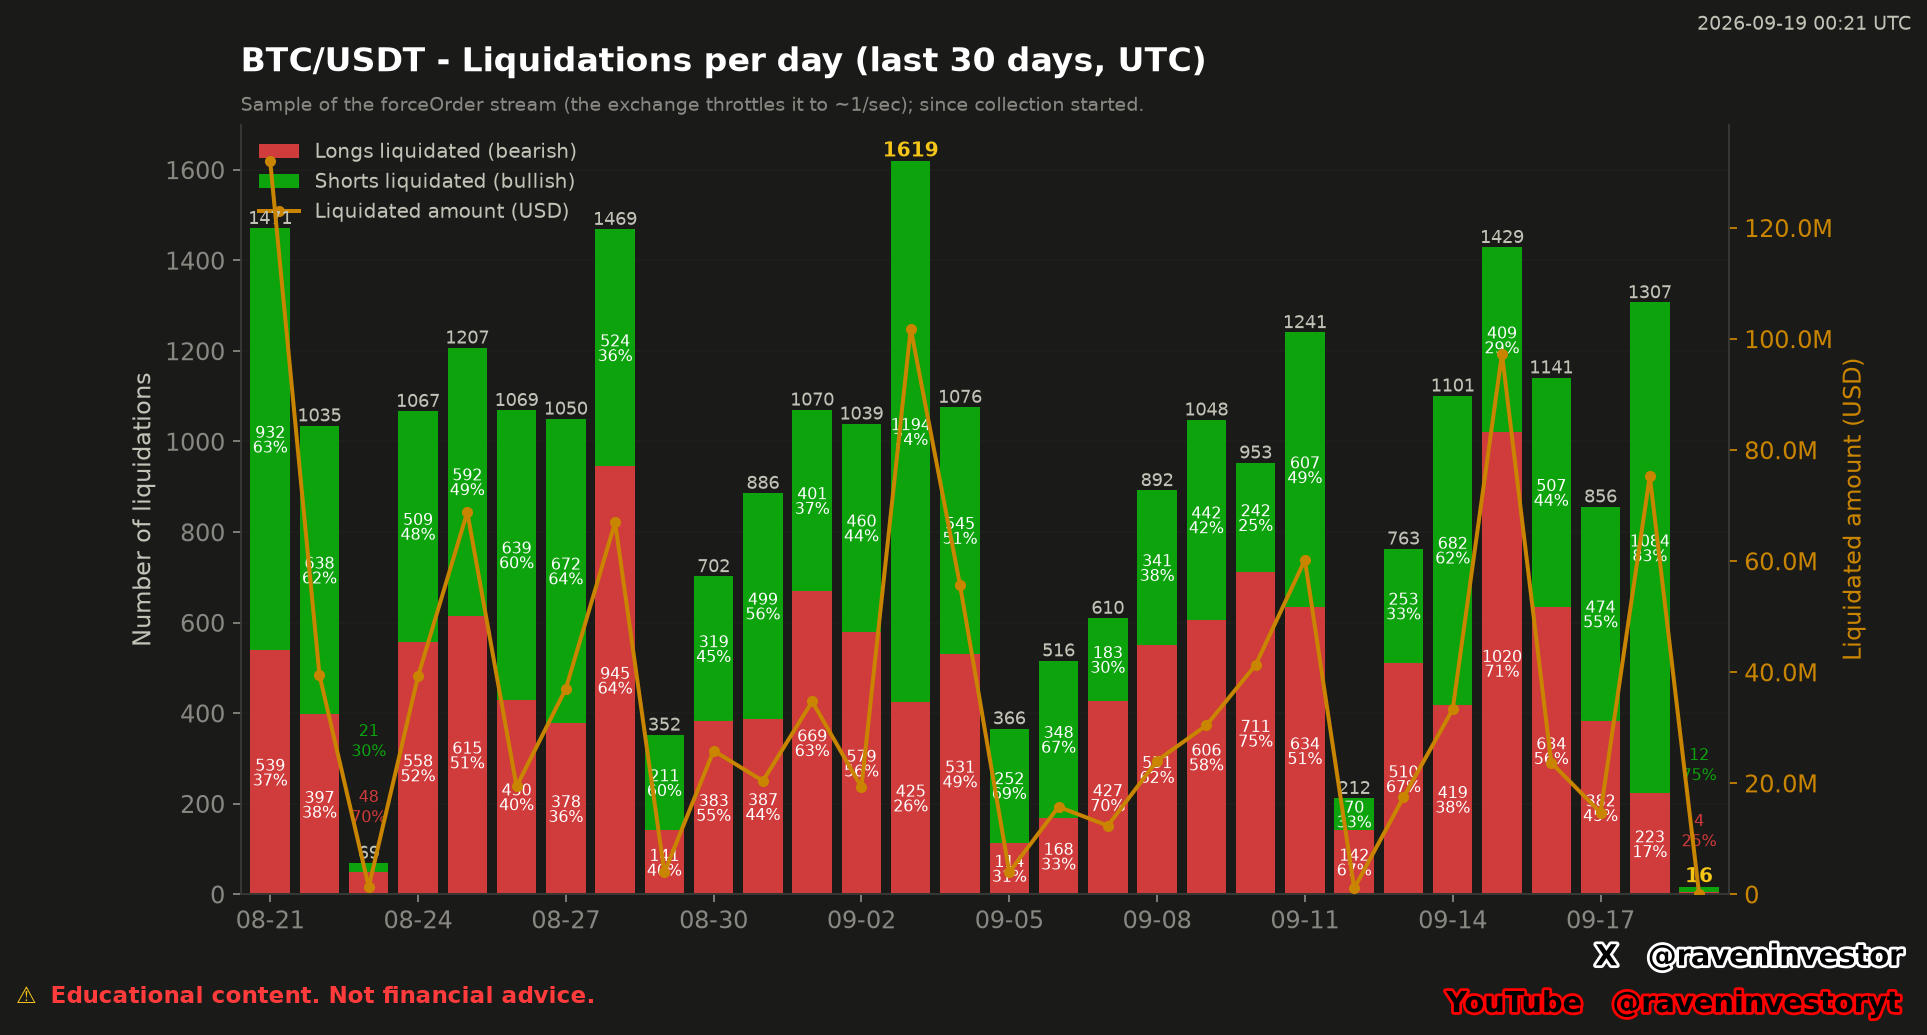
The 30-date UTC sample separates event counts from reported notional. September 3 leads by count, August 21 by amount, while the final date remains incomplete.
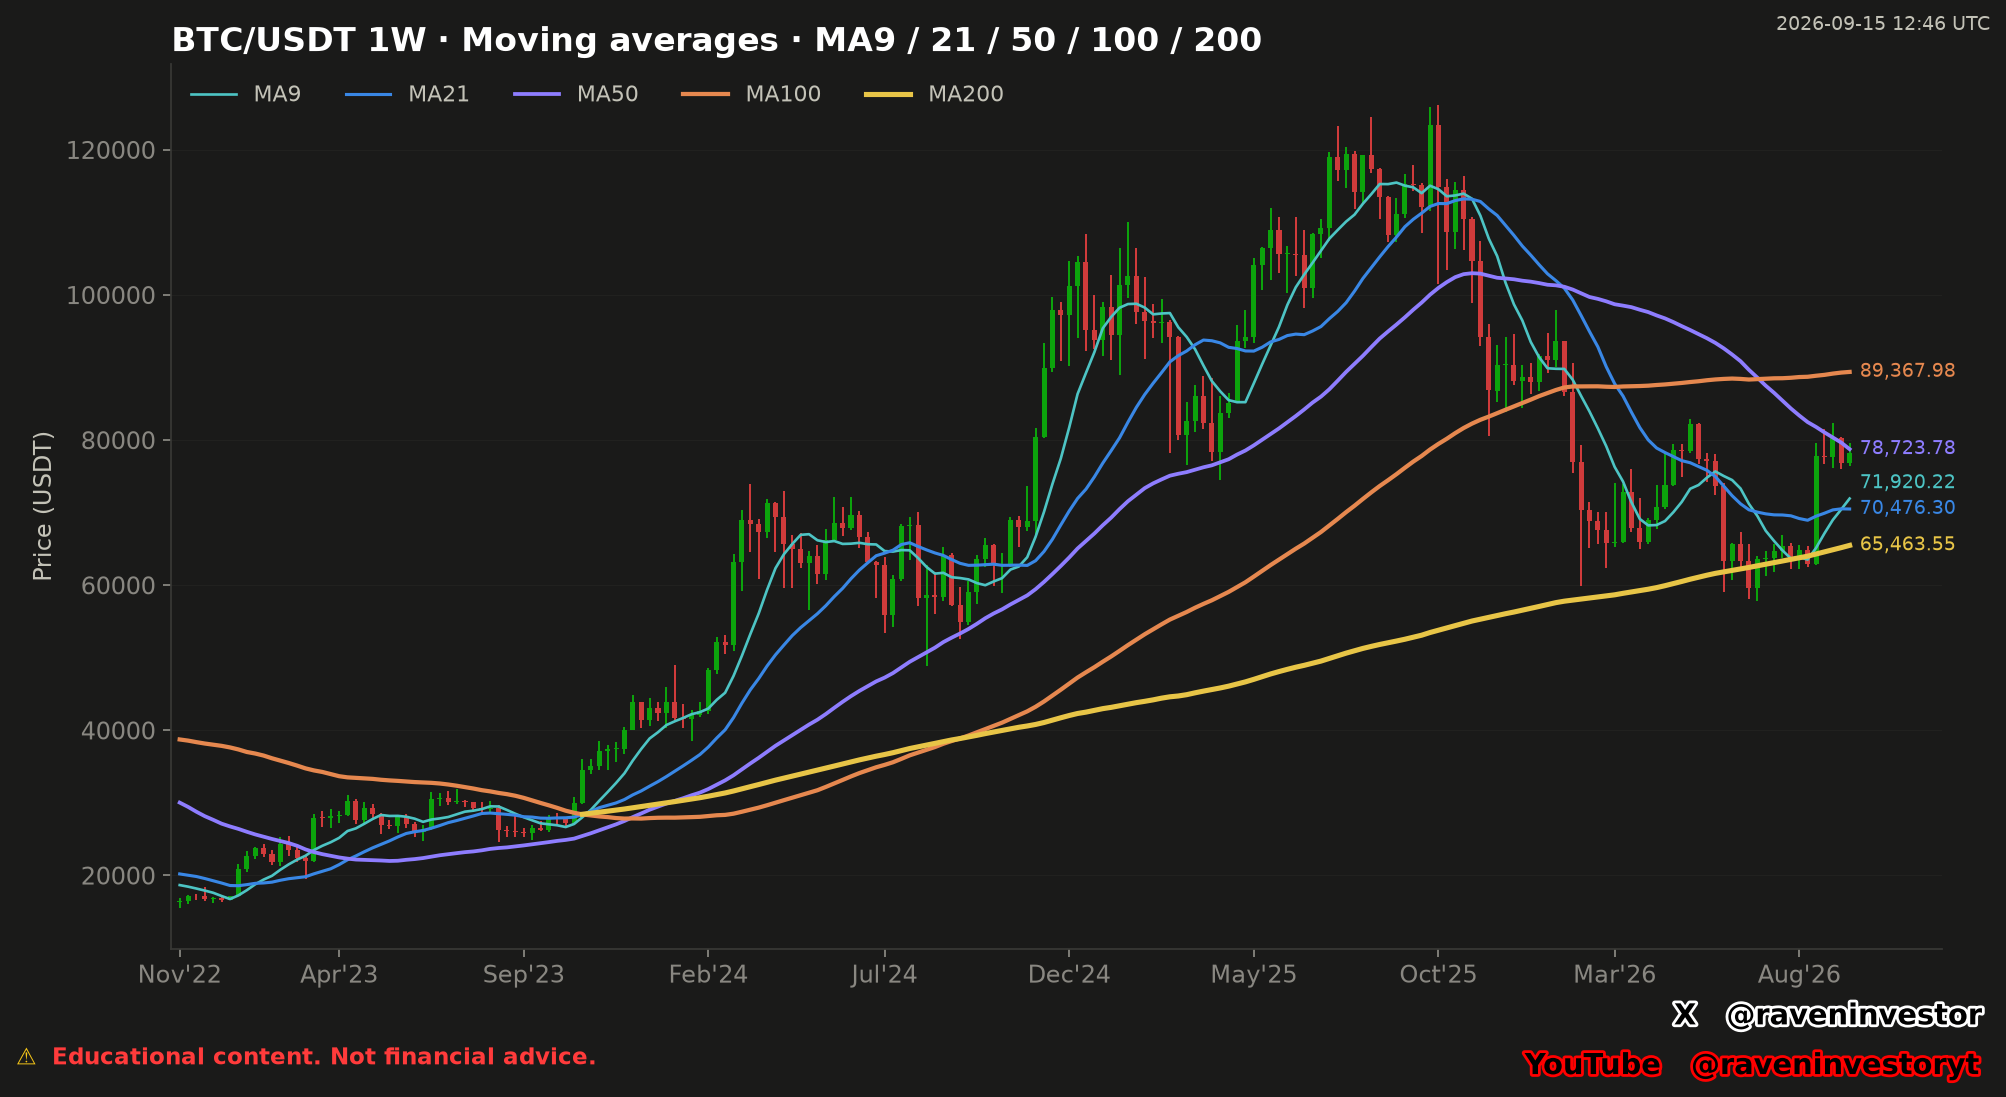
The supplied weekly chart places MA100 highest among the five displayed averages, MA200 lowest, and the faster MA9 above MA21 at the September 15 timestamp.
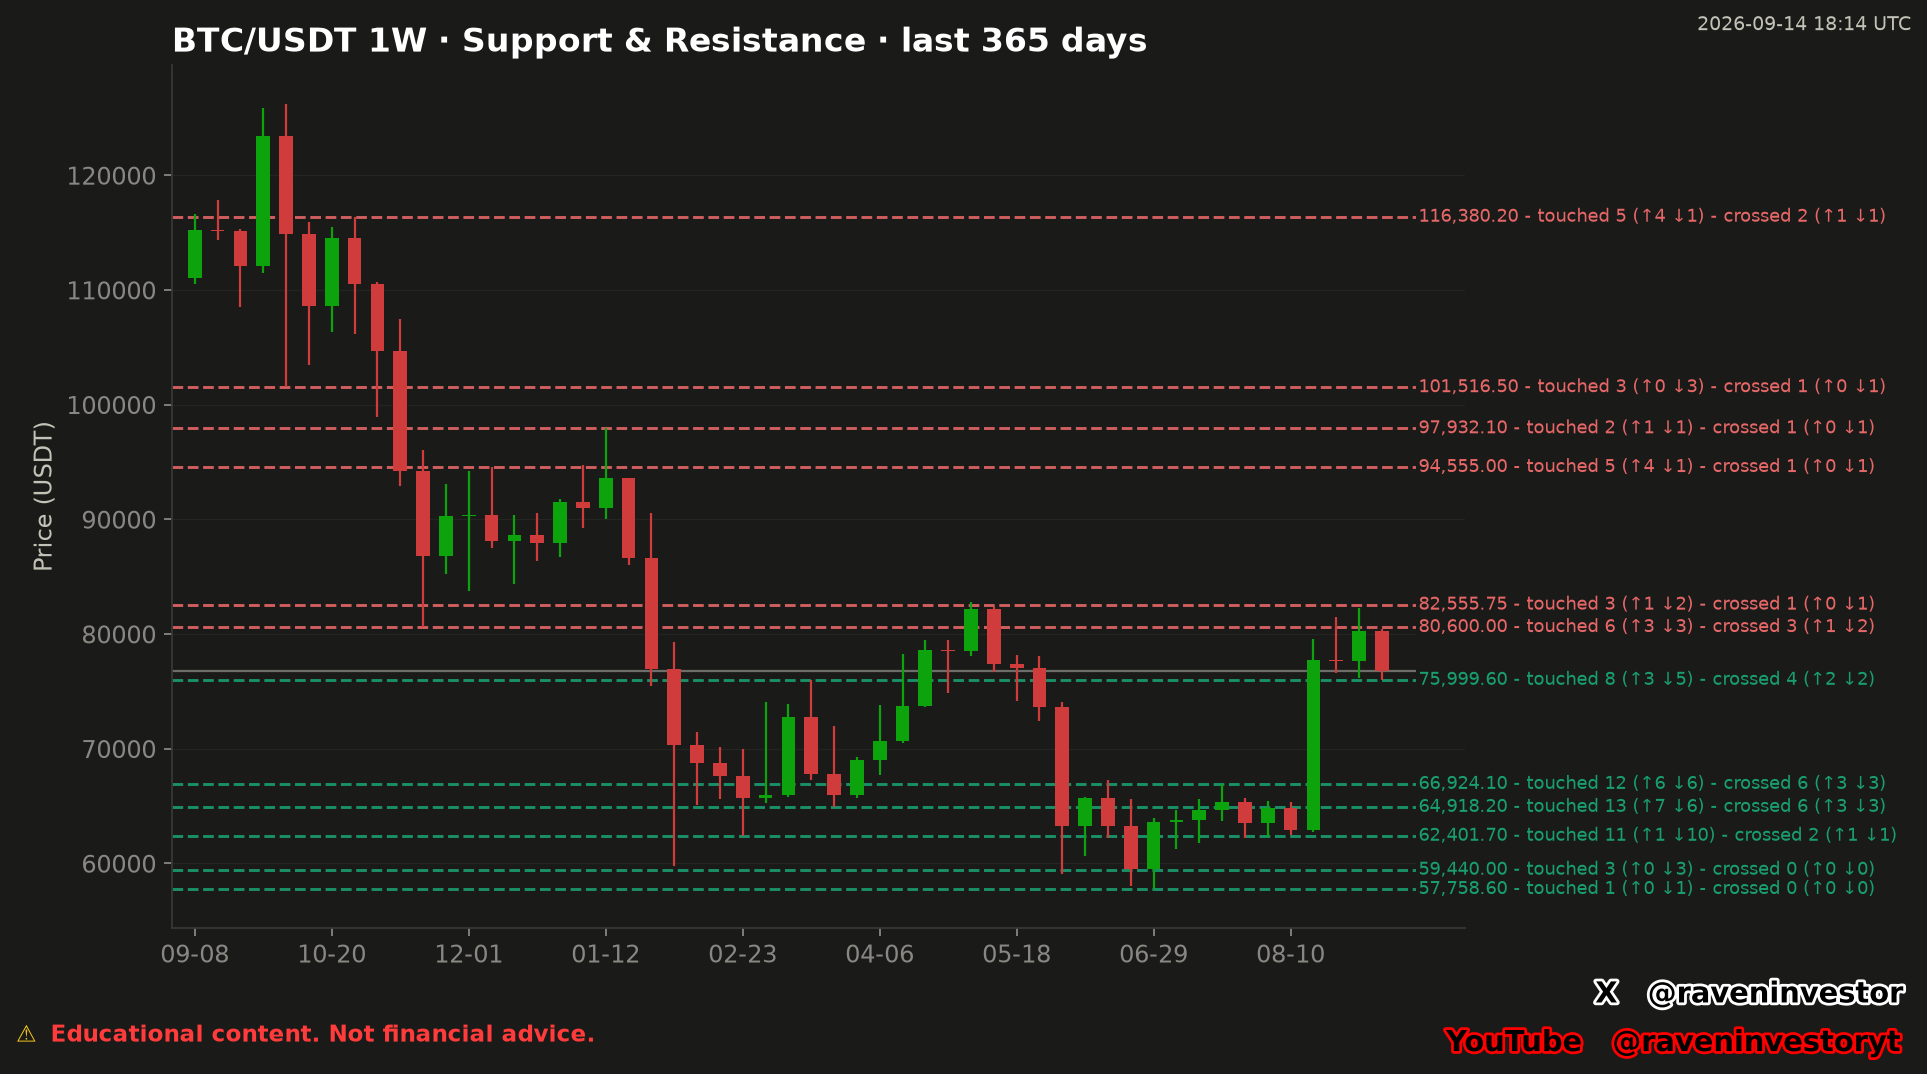
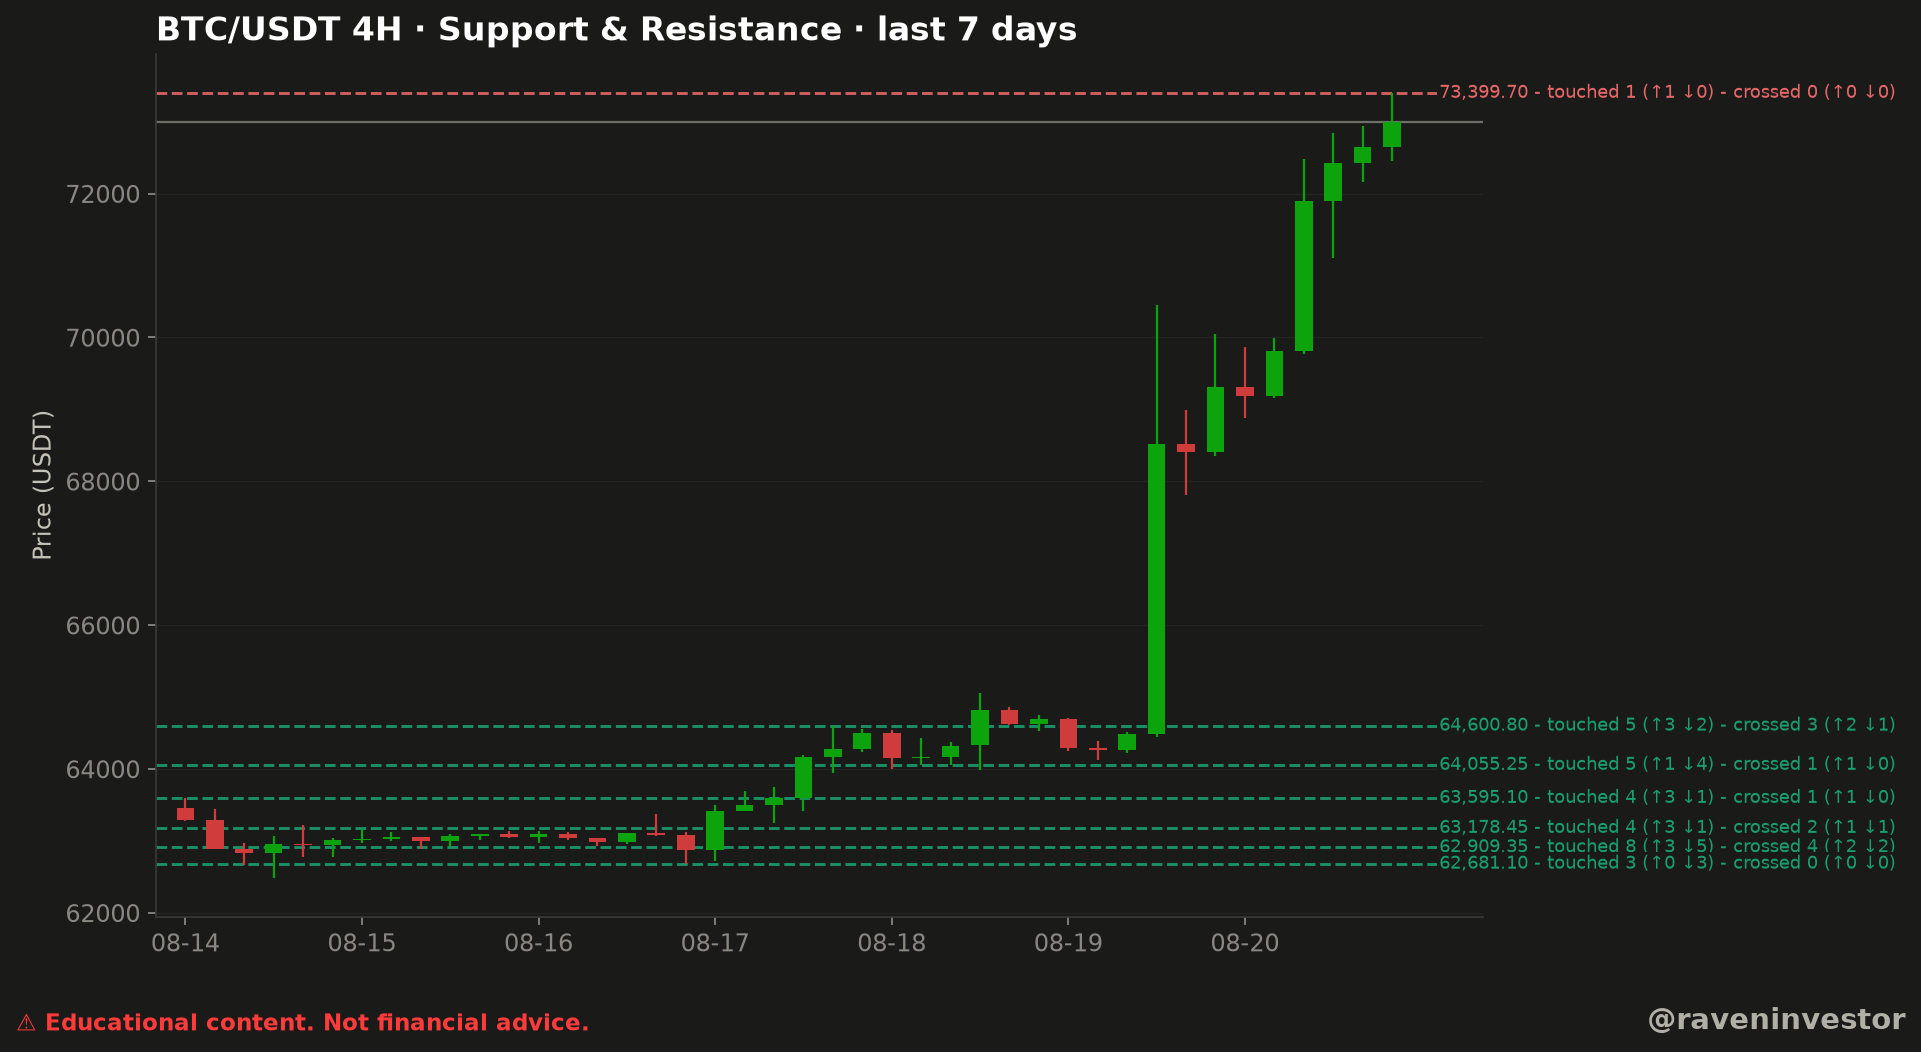
The supplied 365-day, 1-week chart classifies $75,999.60 as its highest displayed support and $80,600.00 as its lowest displayed resistance, with touch and cross counts for every marked level.
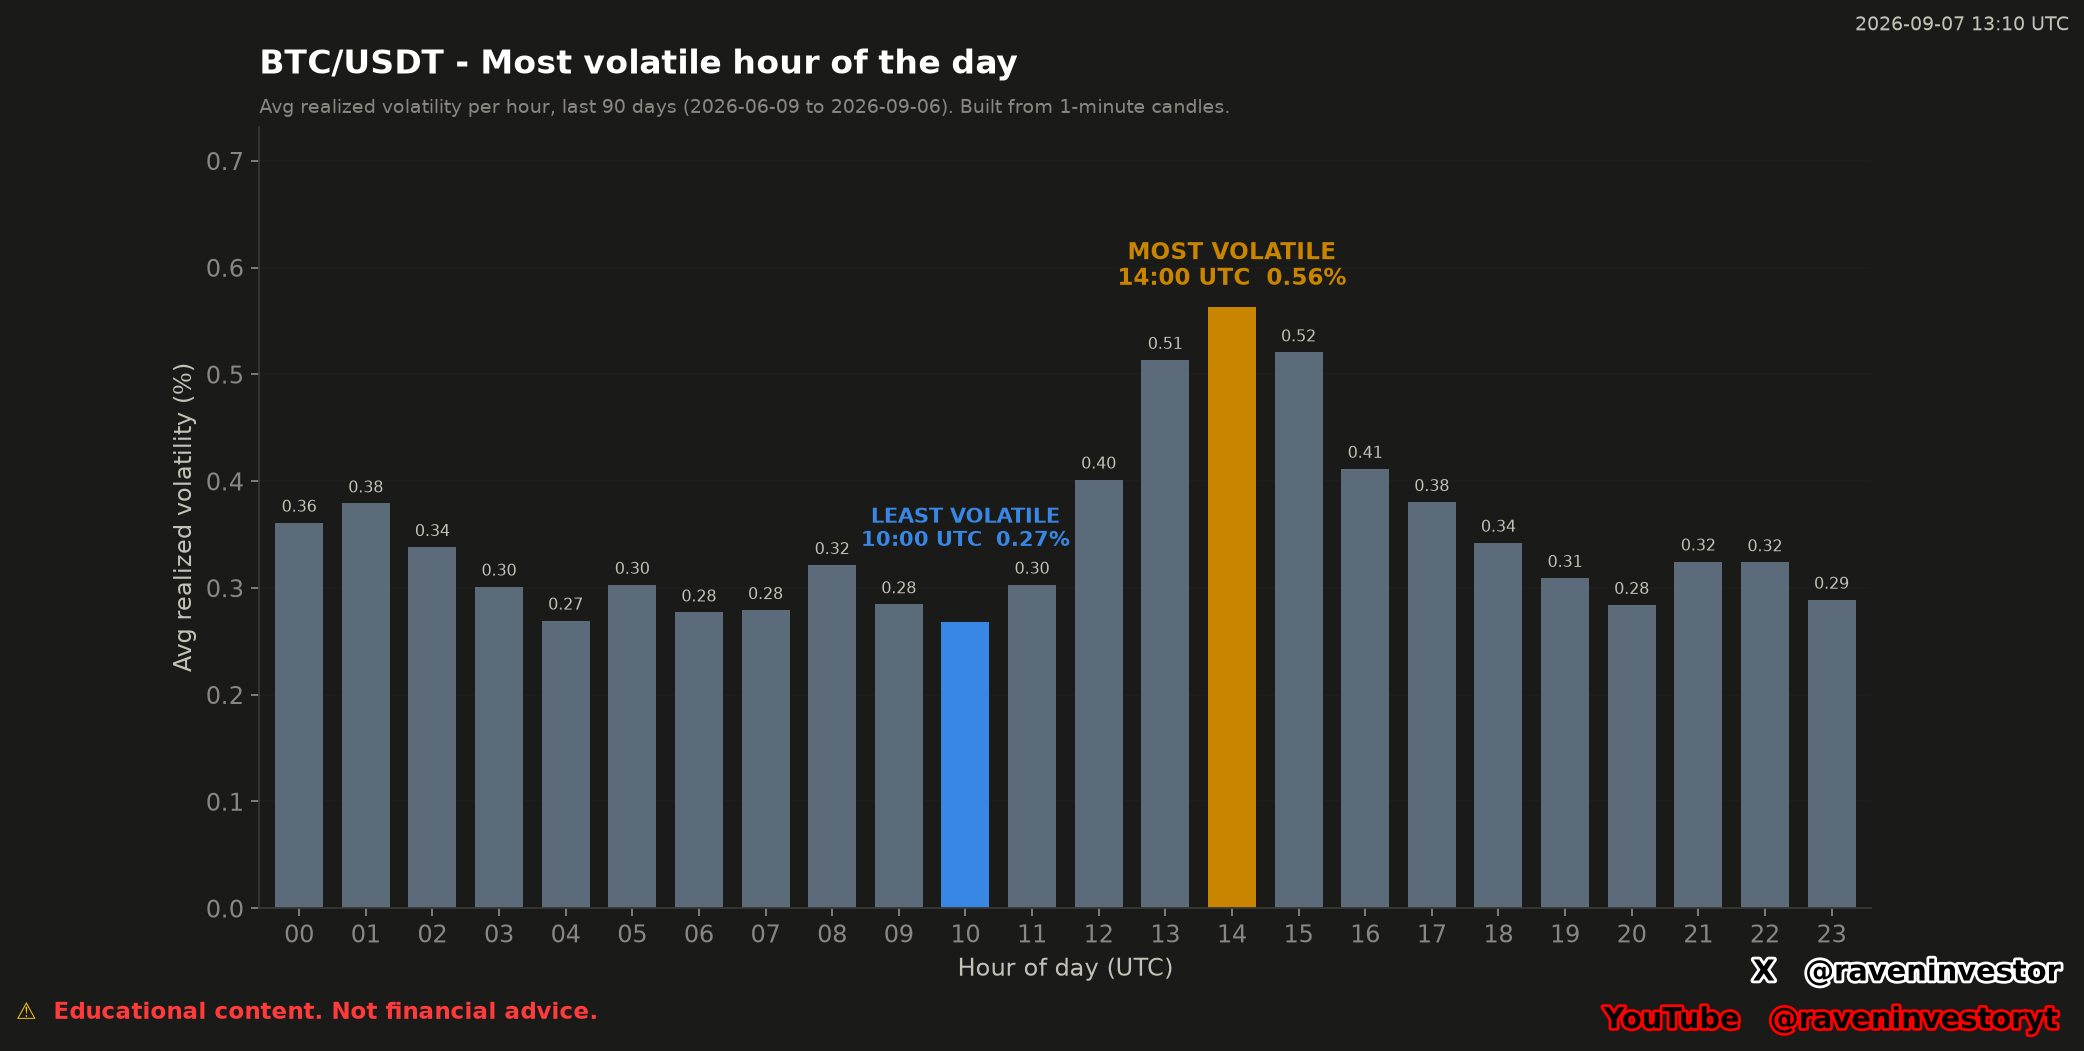
The supplied hourly profile identifies 14:00 UTC at 0.56% as the highest average realized-volatility reading and designates 10:00 UTC as the lowest at 0.27%.
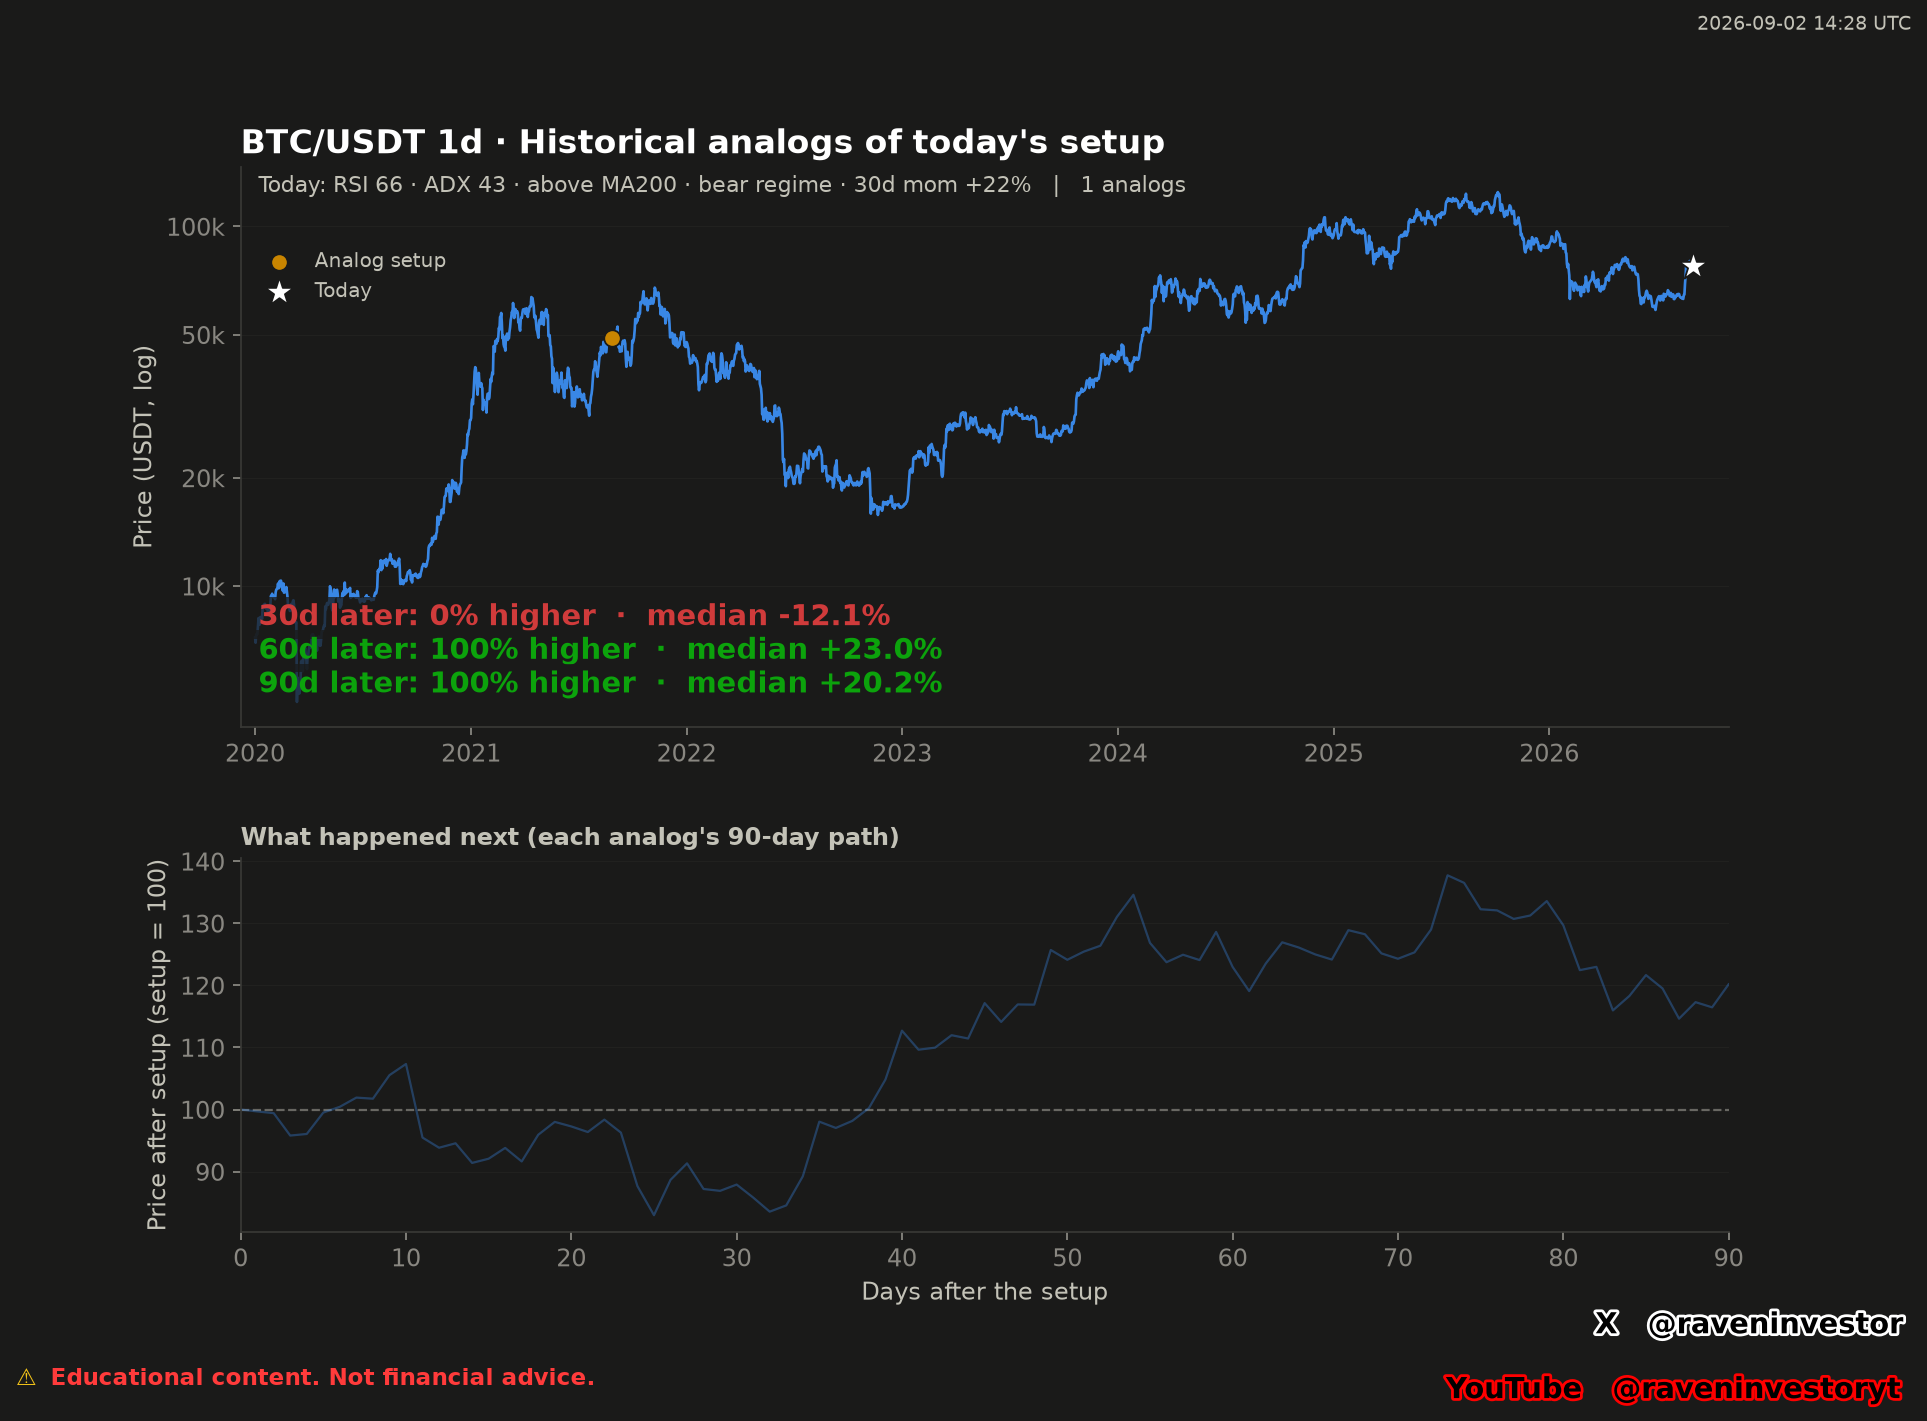
The supplied daily model matches today’s RSI 66, ADX 43, price above MA200, bear-regime label and +22% 30-day momentum to one earlier setup, leaving a historical sample of one.
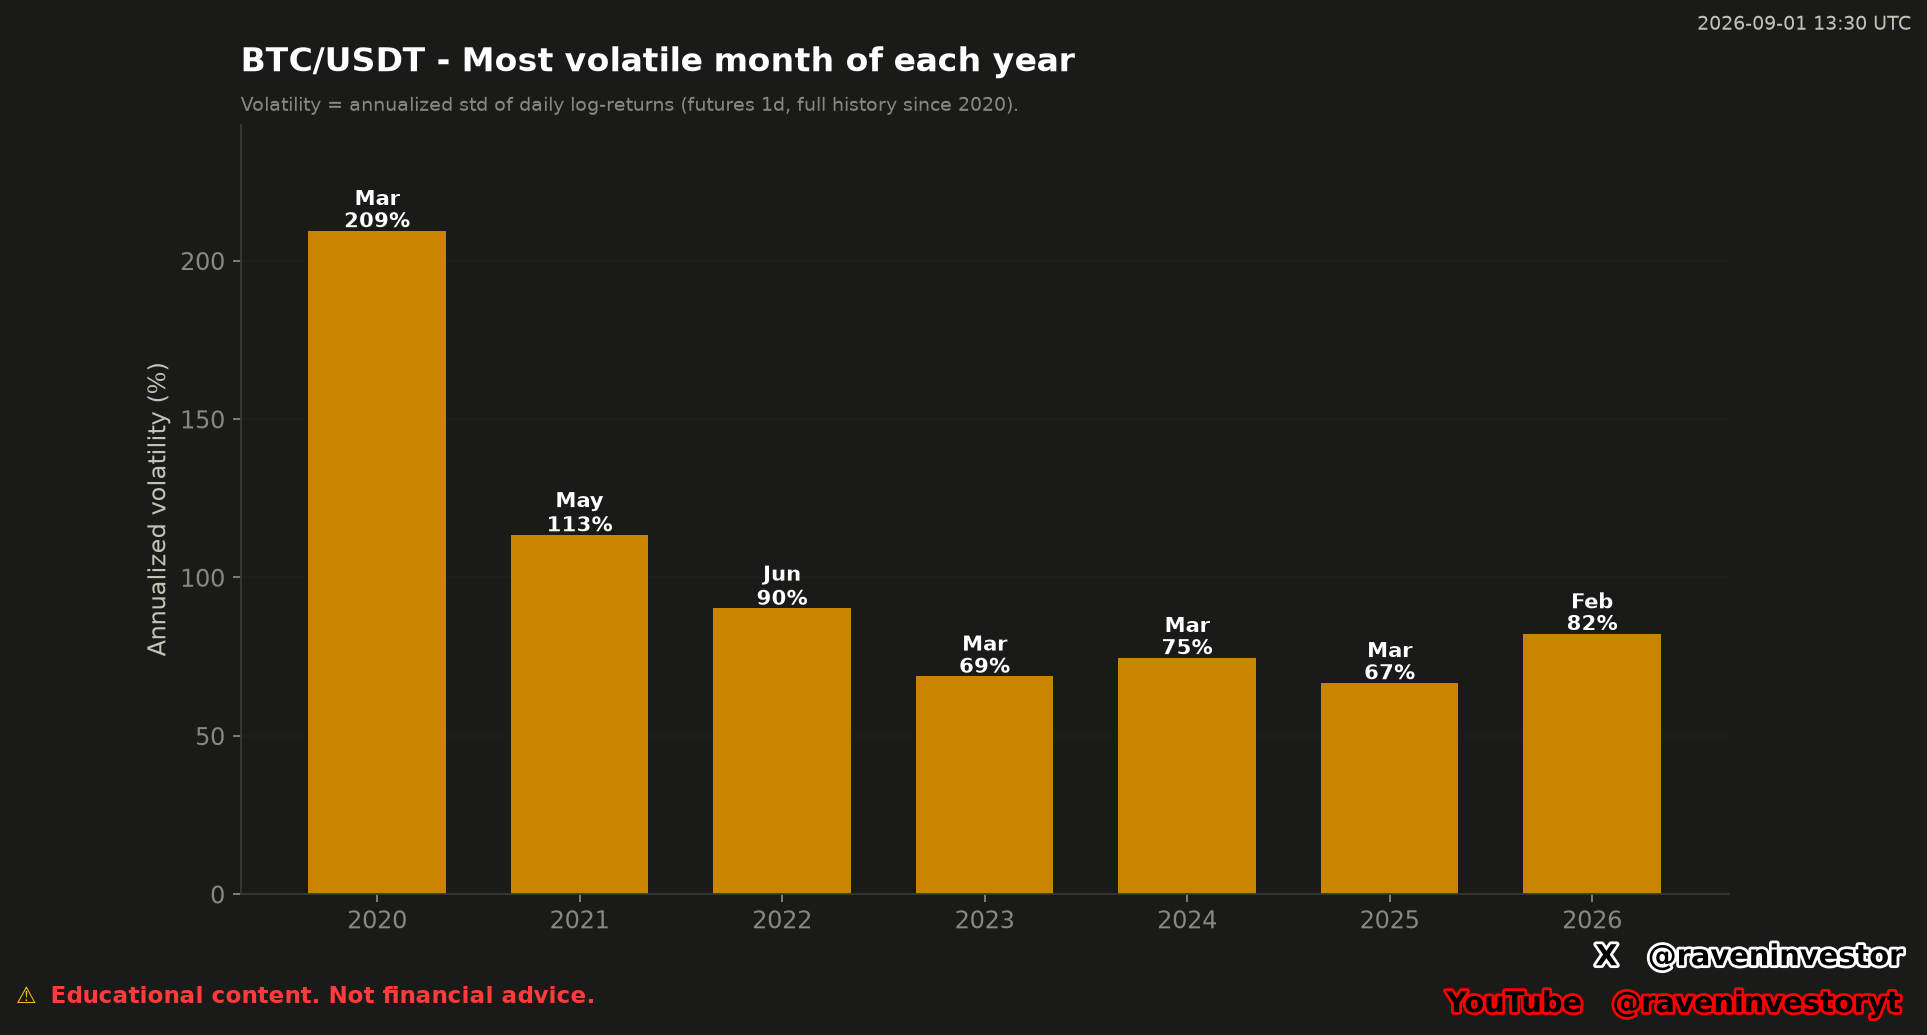
The seven-observation comparison reports March 2020 at 209% annualized volatility and identifies the highest monthly reading shown for every supplied year through the provisional 2026 sample.
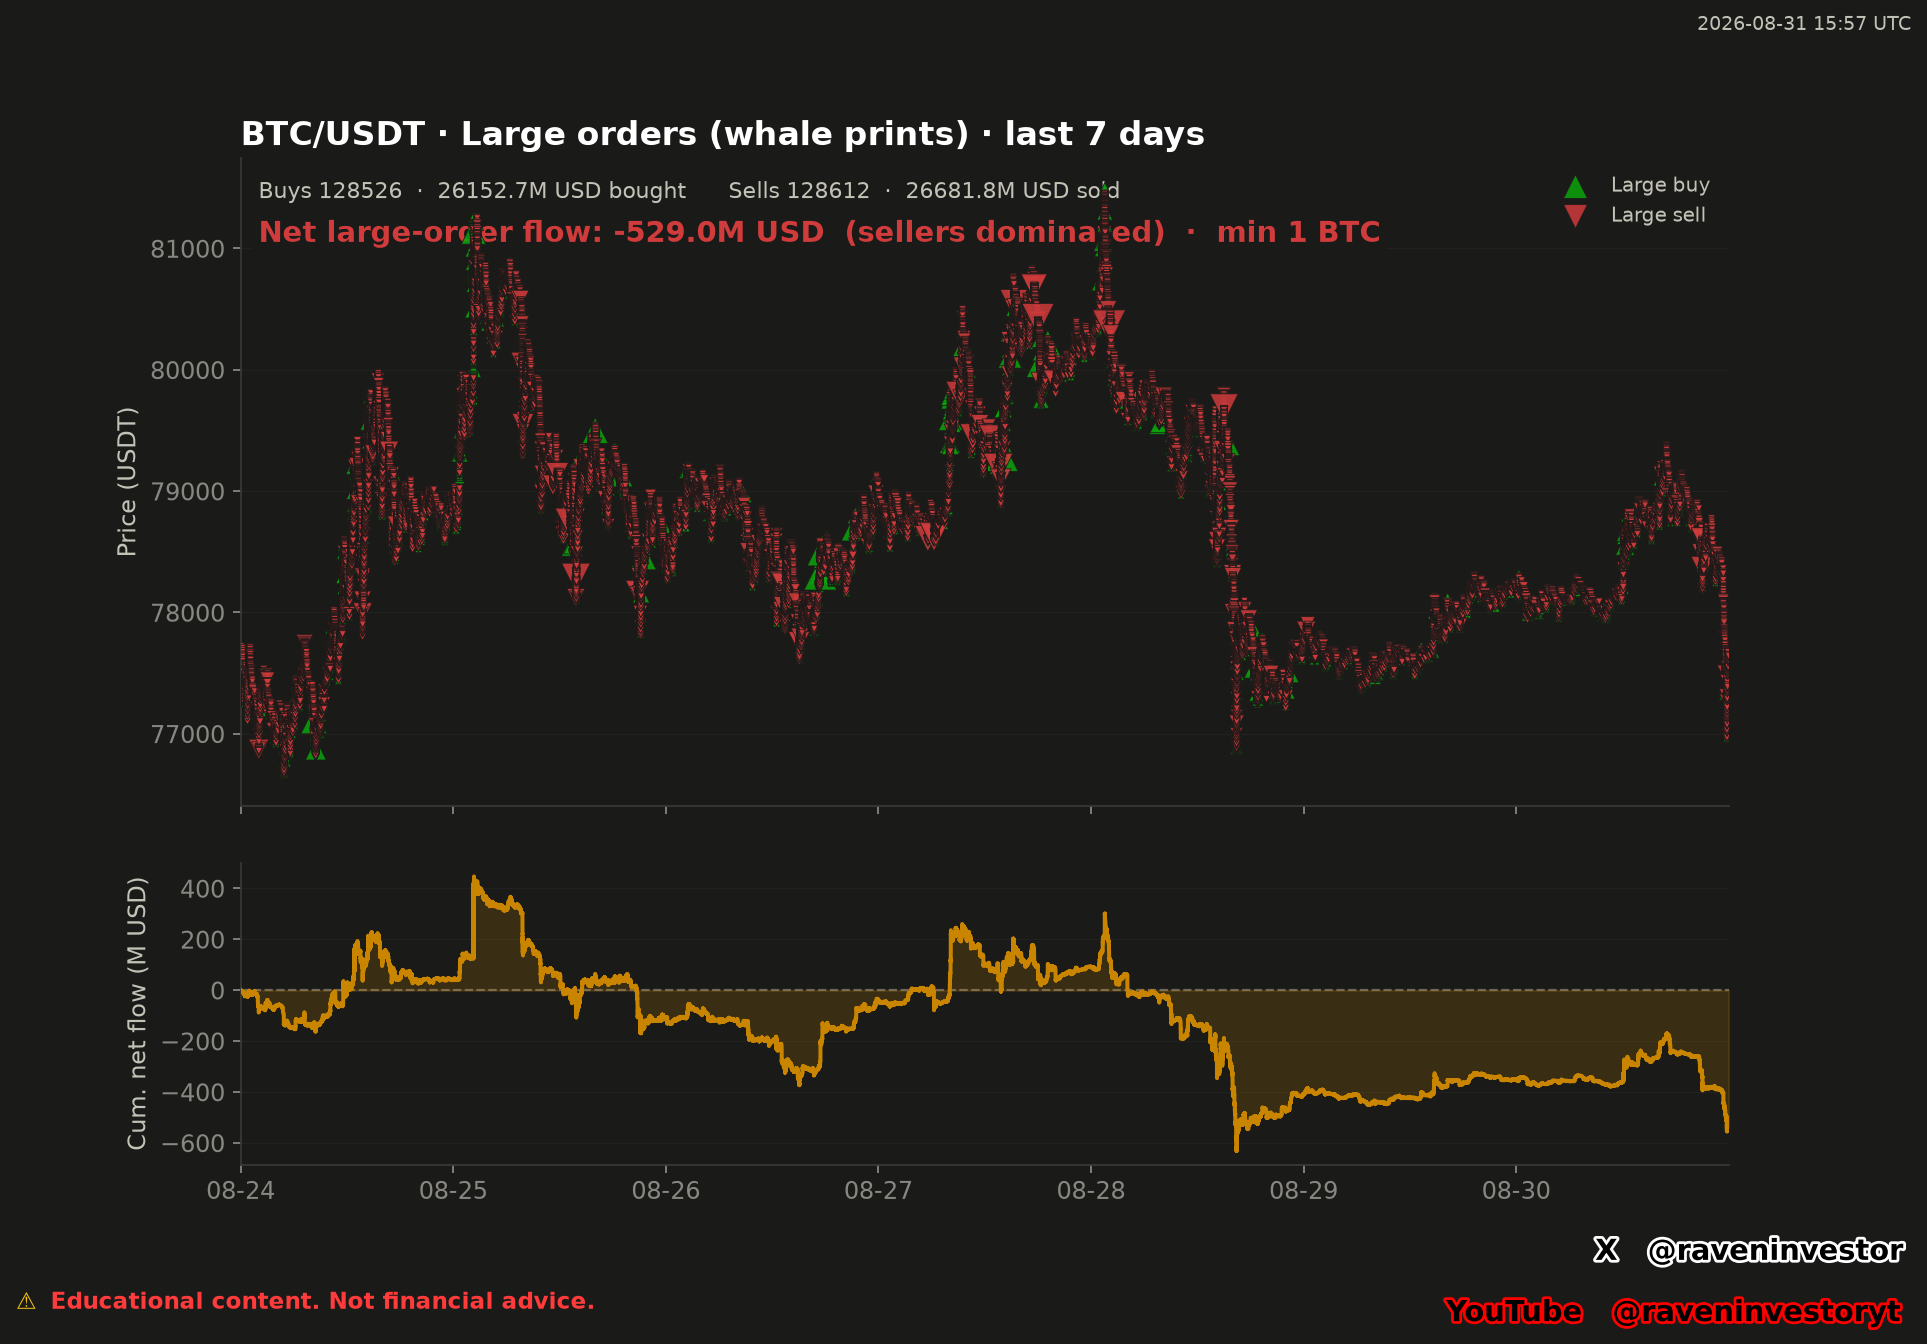
The chart records 128,526 large buys and 128,612 large sells under its 1 BTC minimum, with reported sold value above bought value and cumulative flow finishing negative.
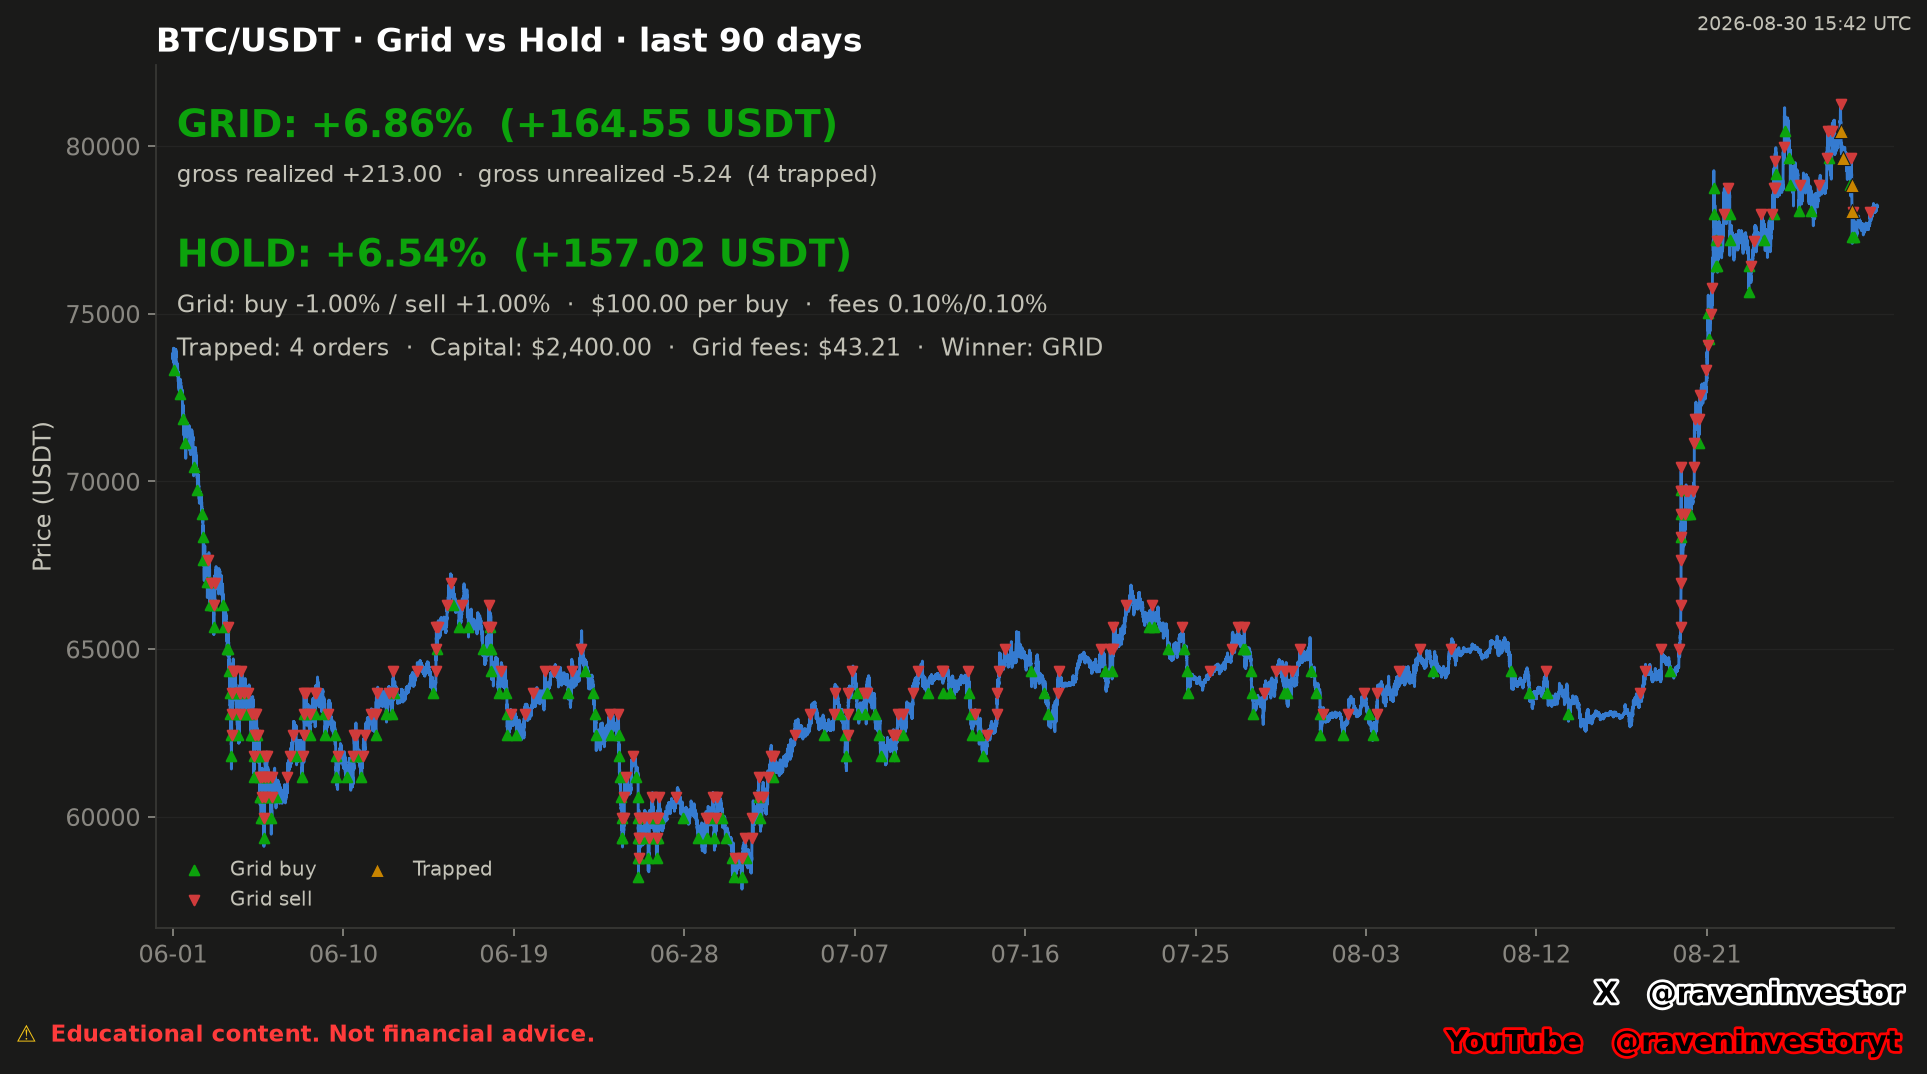
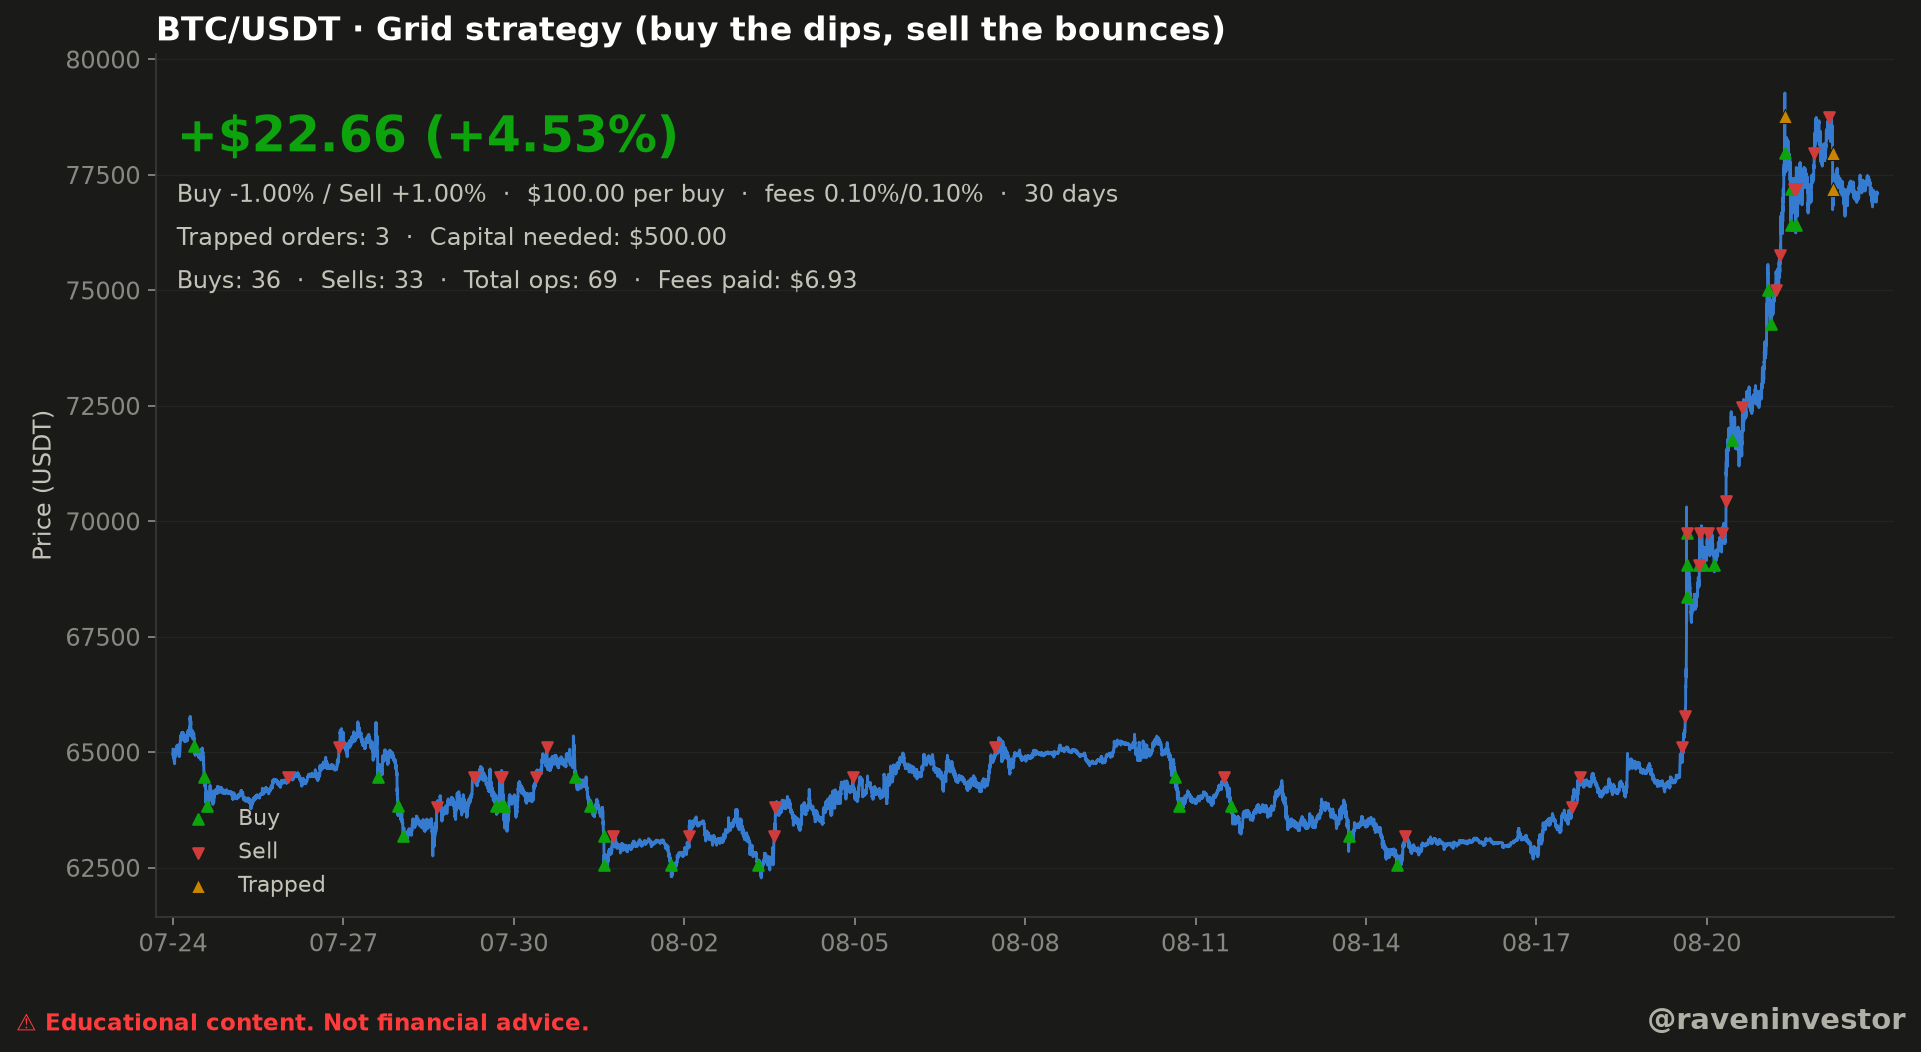
The chart names grid the winner in this single historical window while also reporting gross realized and unrealized components, four trapped orders and grid fees.
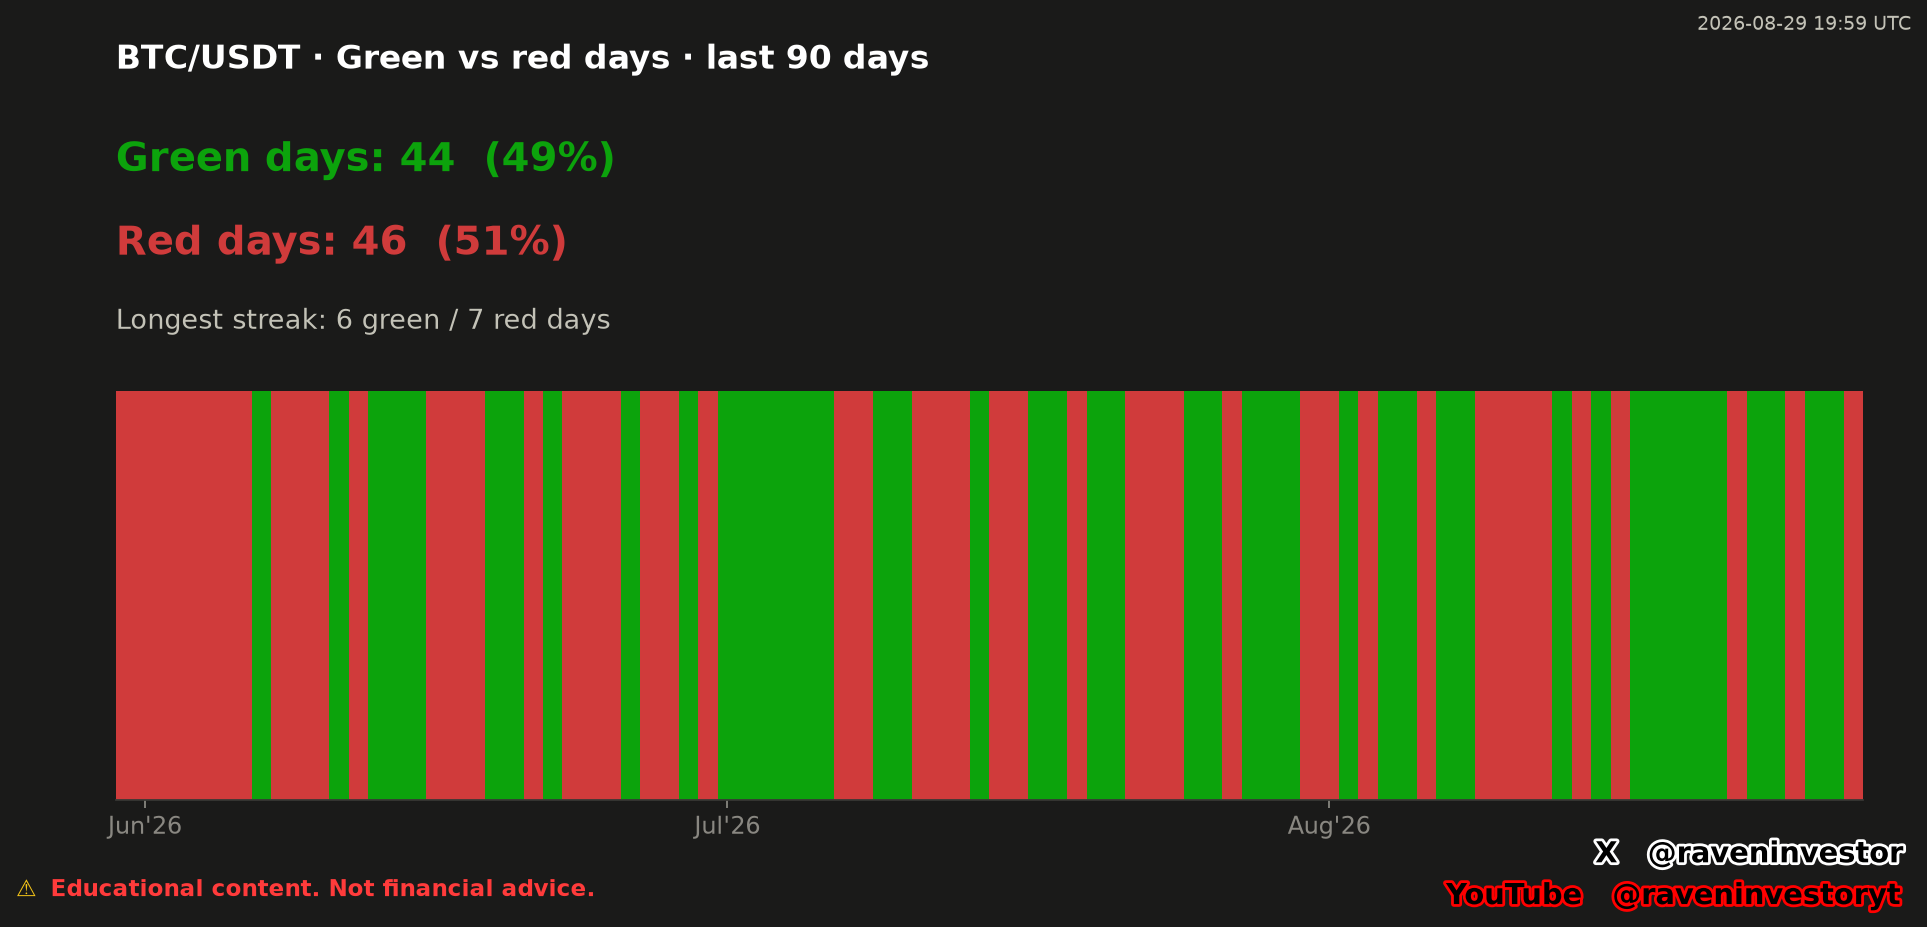
The supplied classification is closely divided between 44 green sessions and 46 red sessions, while its longest displayed runs contain six green days and seven red days.
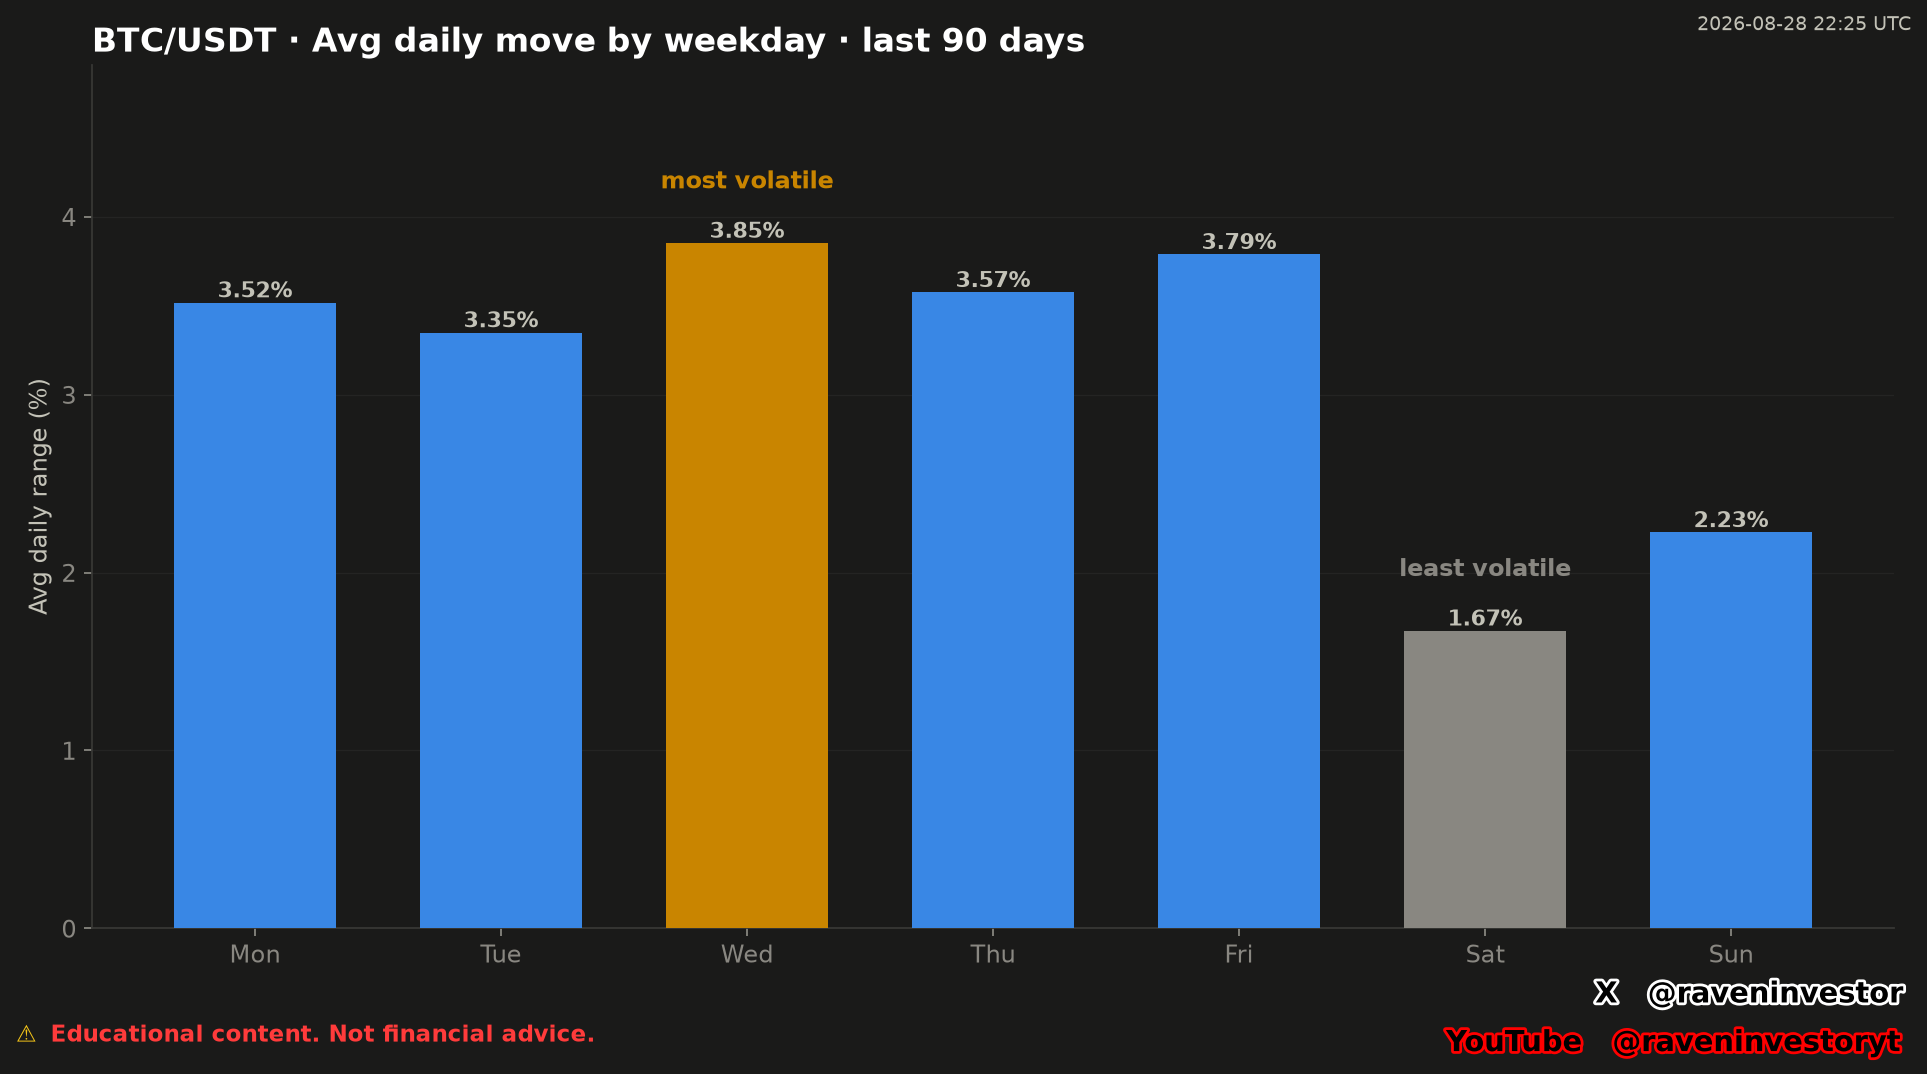
The weekday grouping places Wednesday and Friday at the top of the supplied range averages, while Saturday and Sunday record the two lowest displayed values.
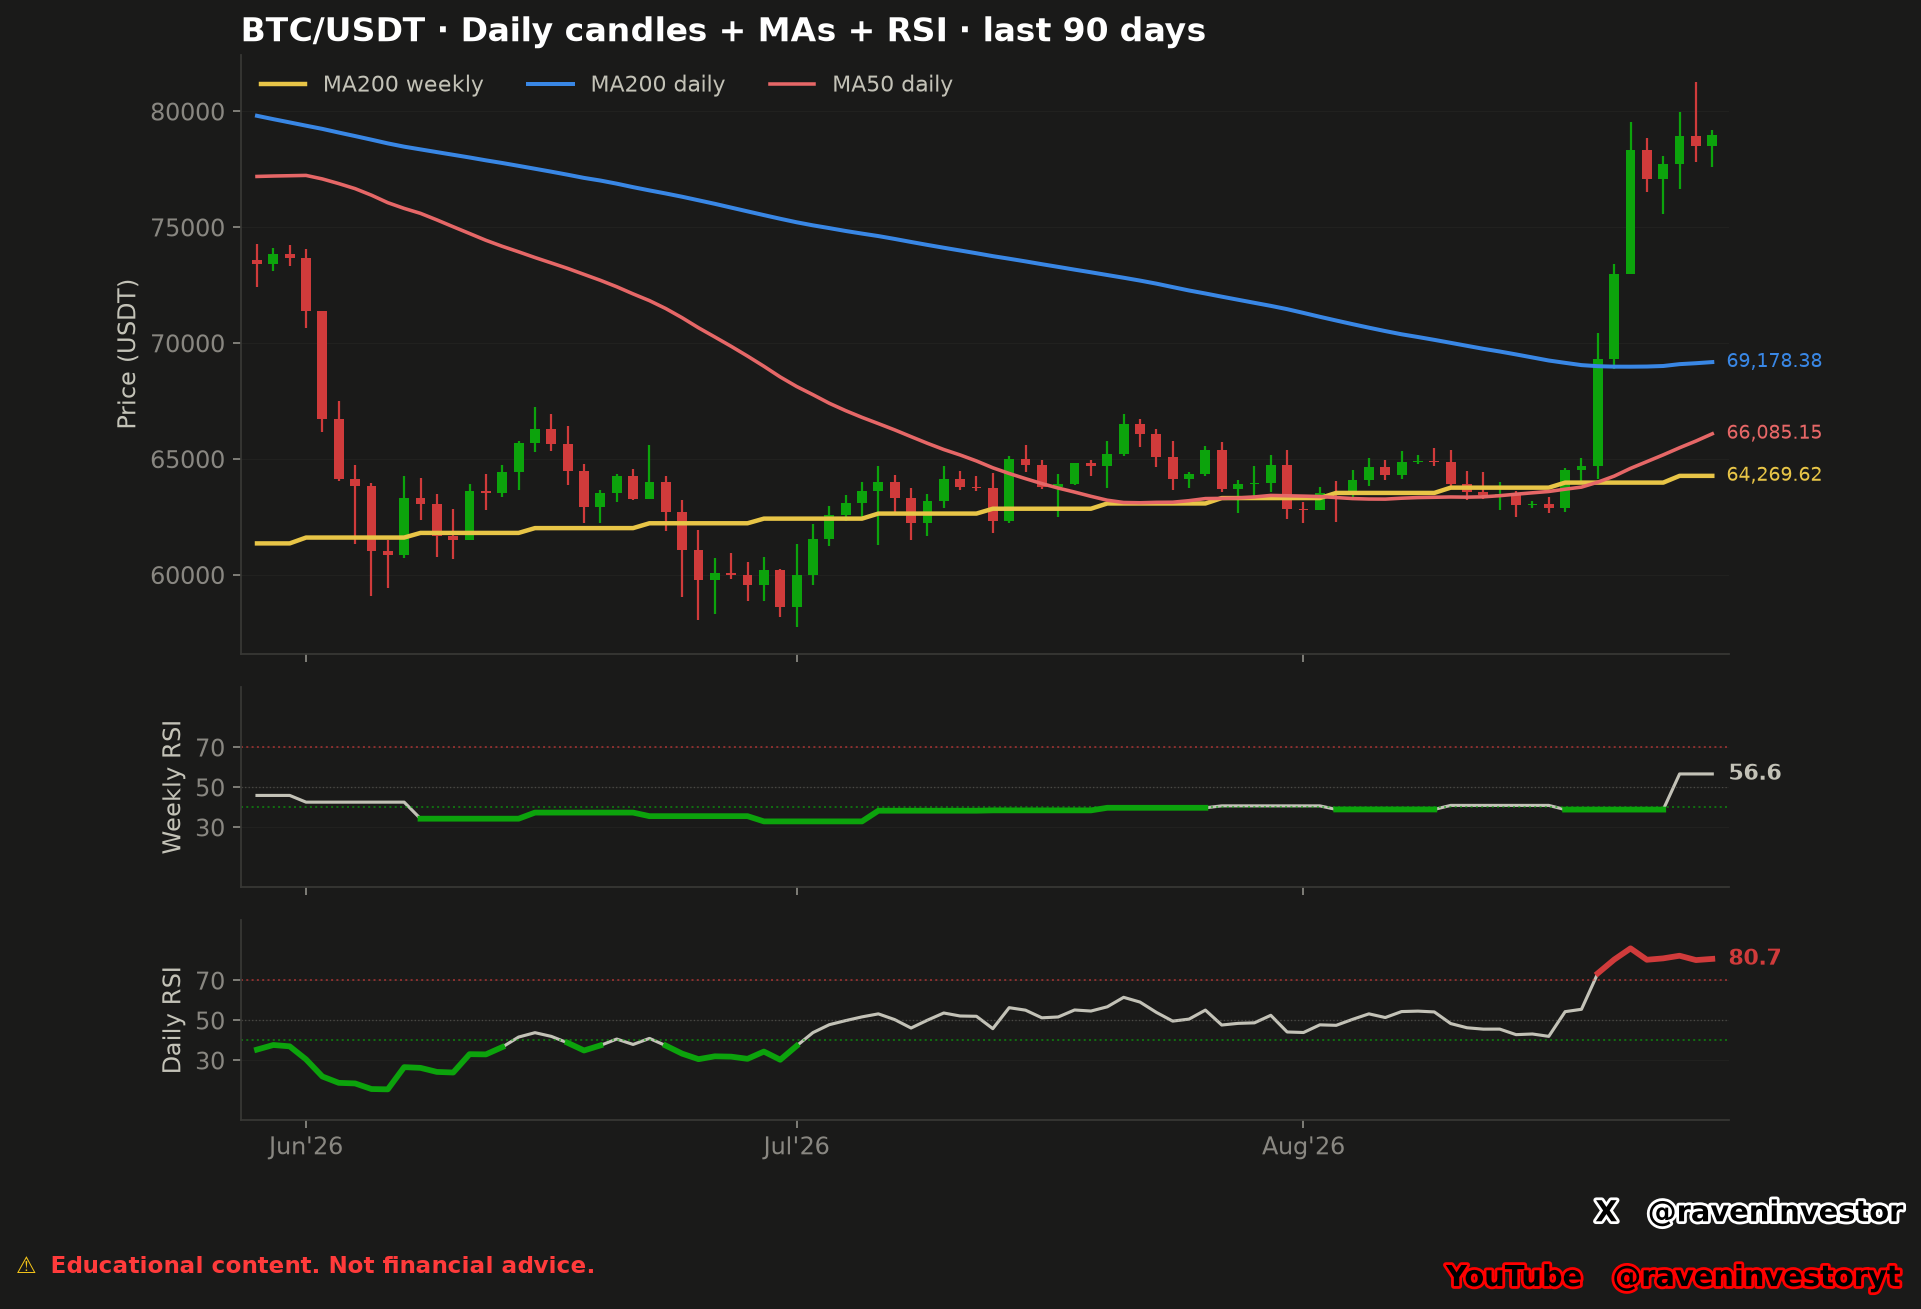
The supplied 90-day chart combines a high daily RSI reading with a lower weekly RSI and three moving-average references below the latest visible candles.
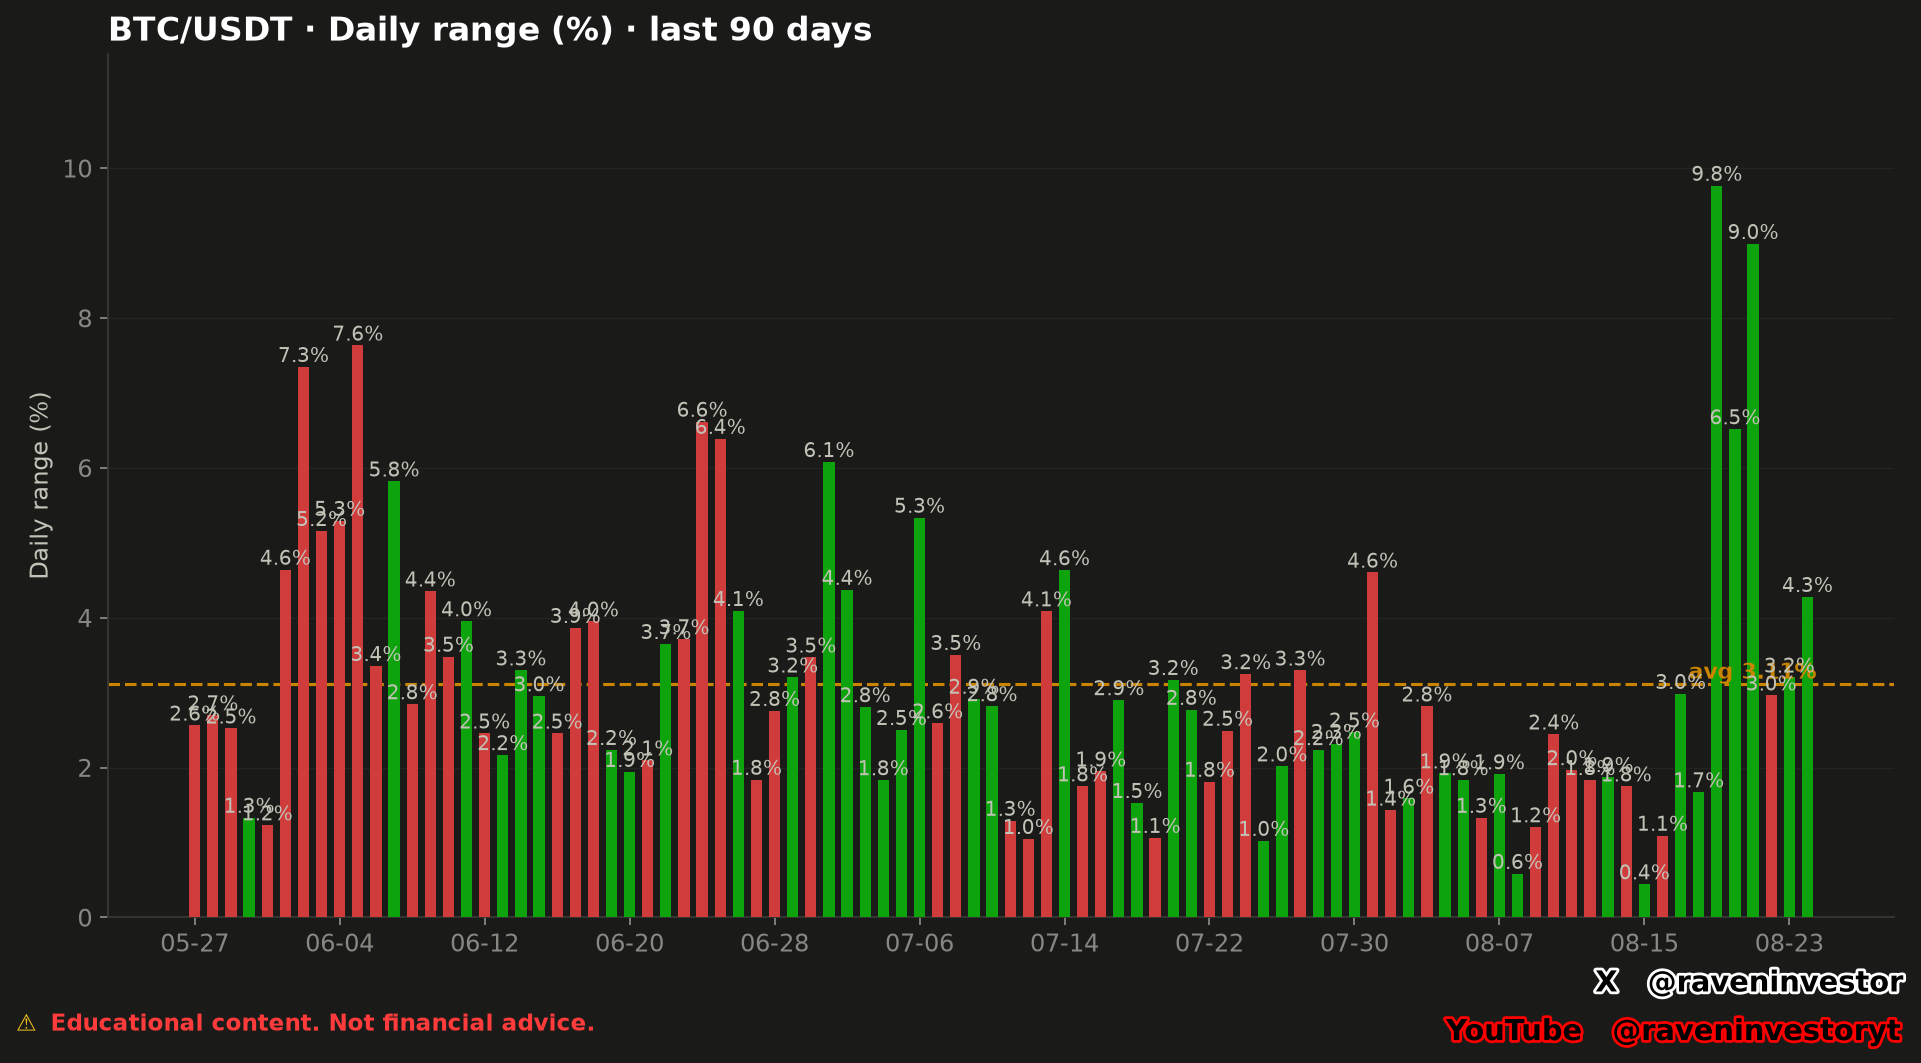
The chart places the average daily range at 3.1%, while its visible labels extend from 0.4% to 9.8% and the largest observations appear late in the window.
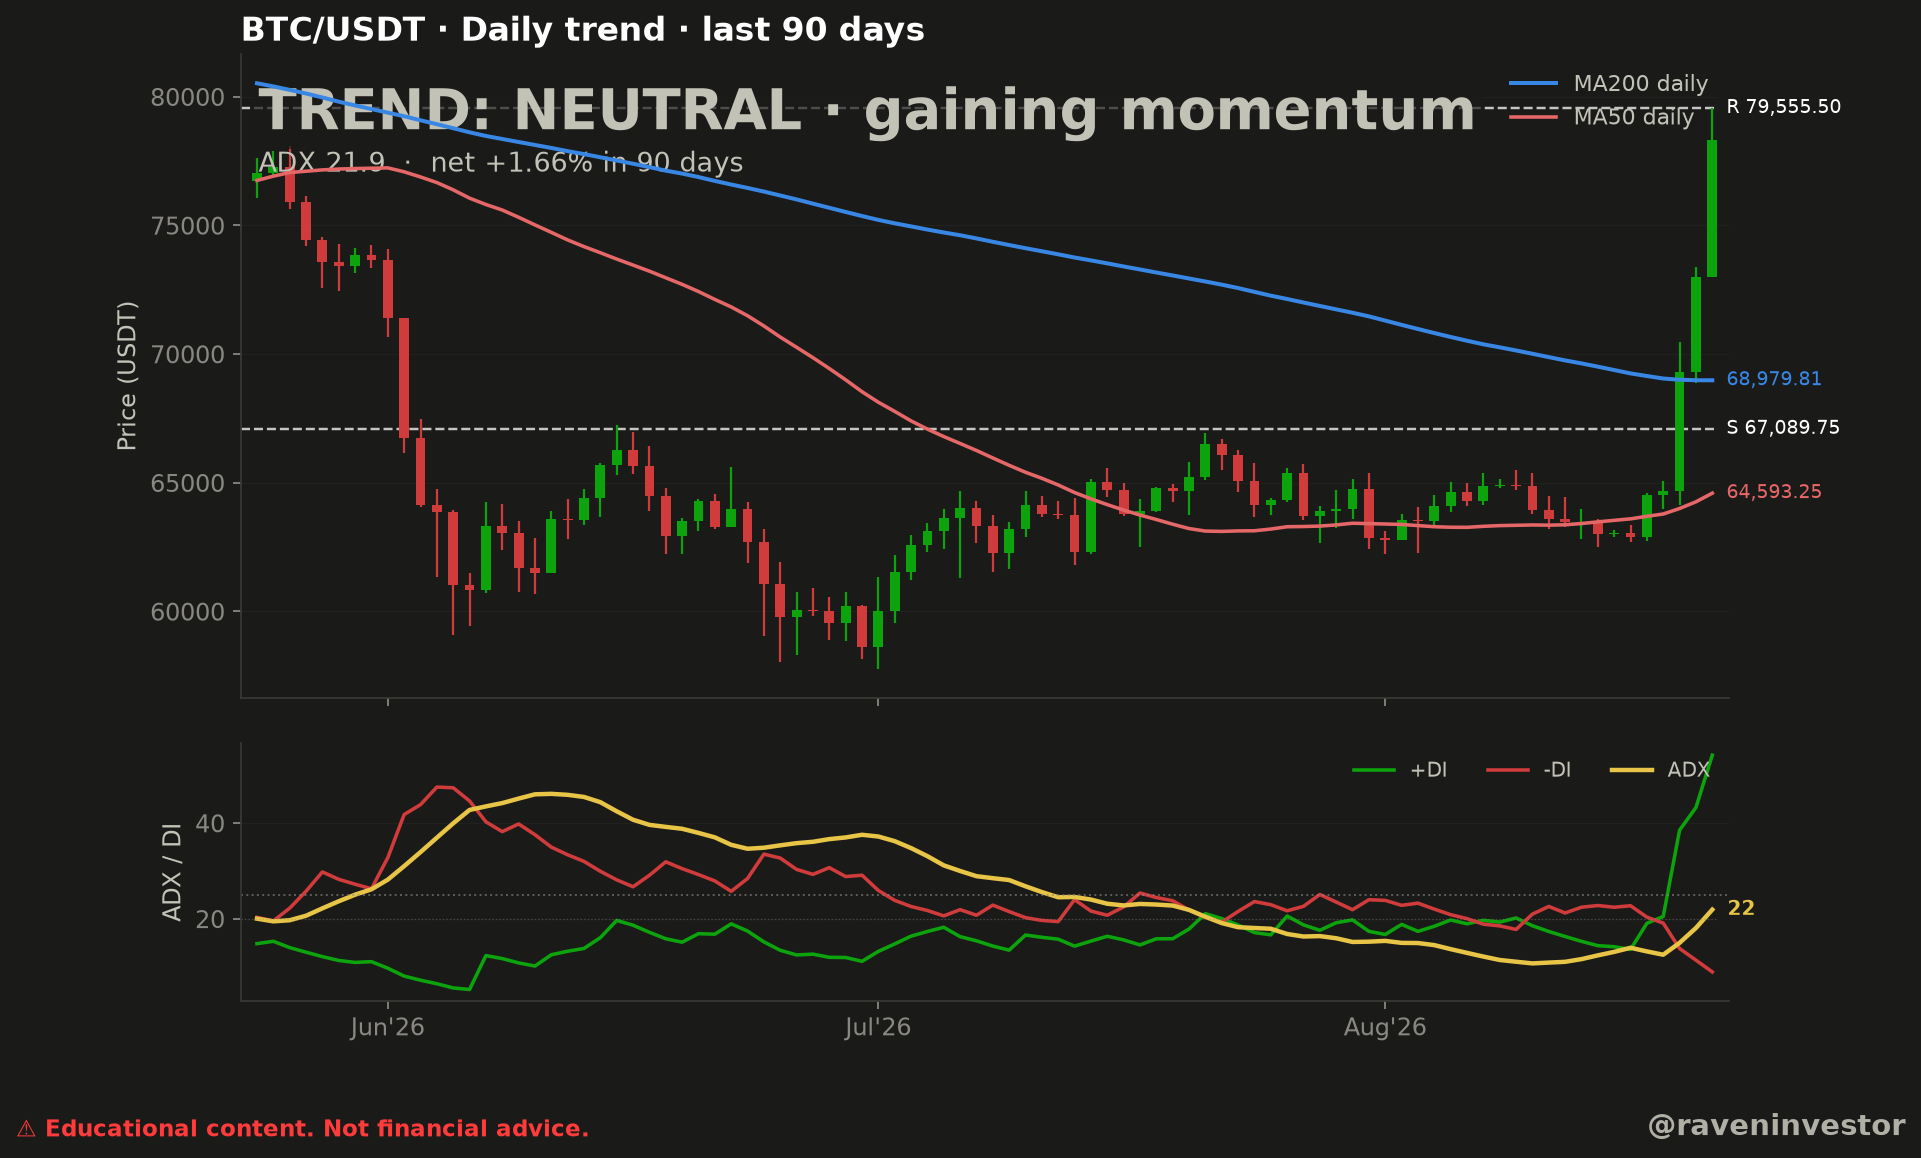
The 90-day daily chart combines a neutral trend classification with ADX at 21.9, a rising +DI line at the right edge, and four marked reference levels.
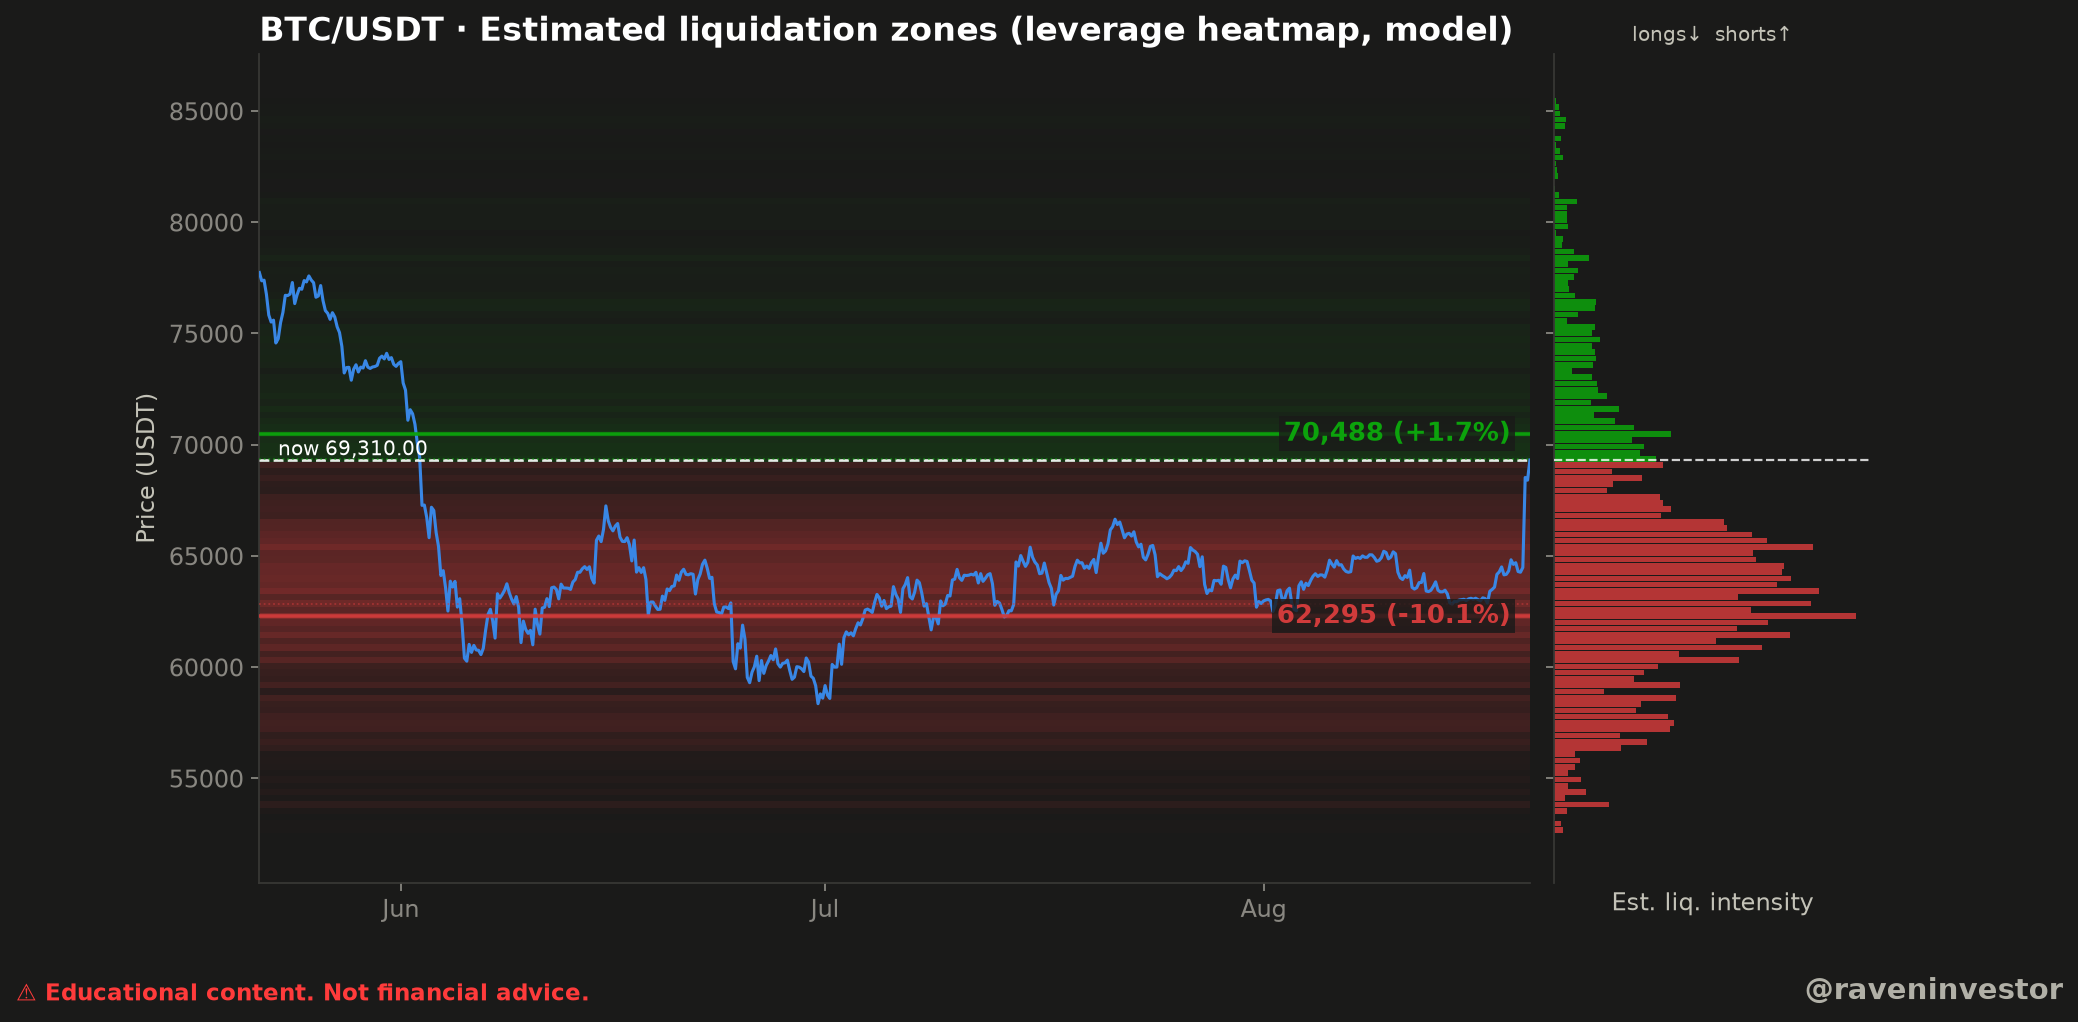
The model places a highlighted estimated short-liquidation zone above the displayed price and a broader field of estimated long-liquidation intensity below it.