What the study actually finds
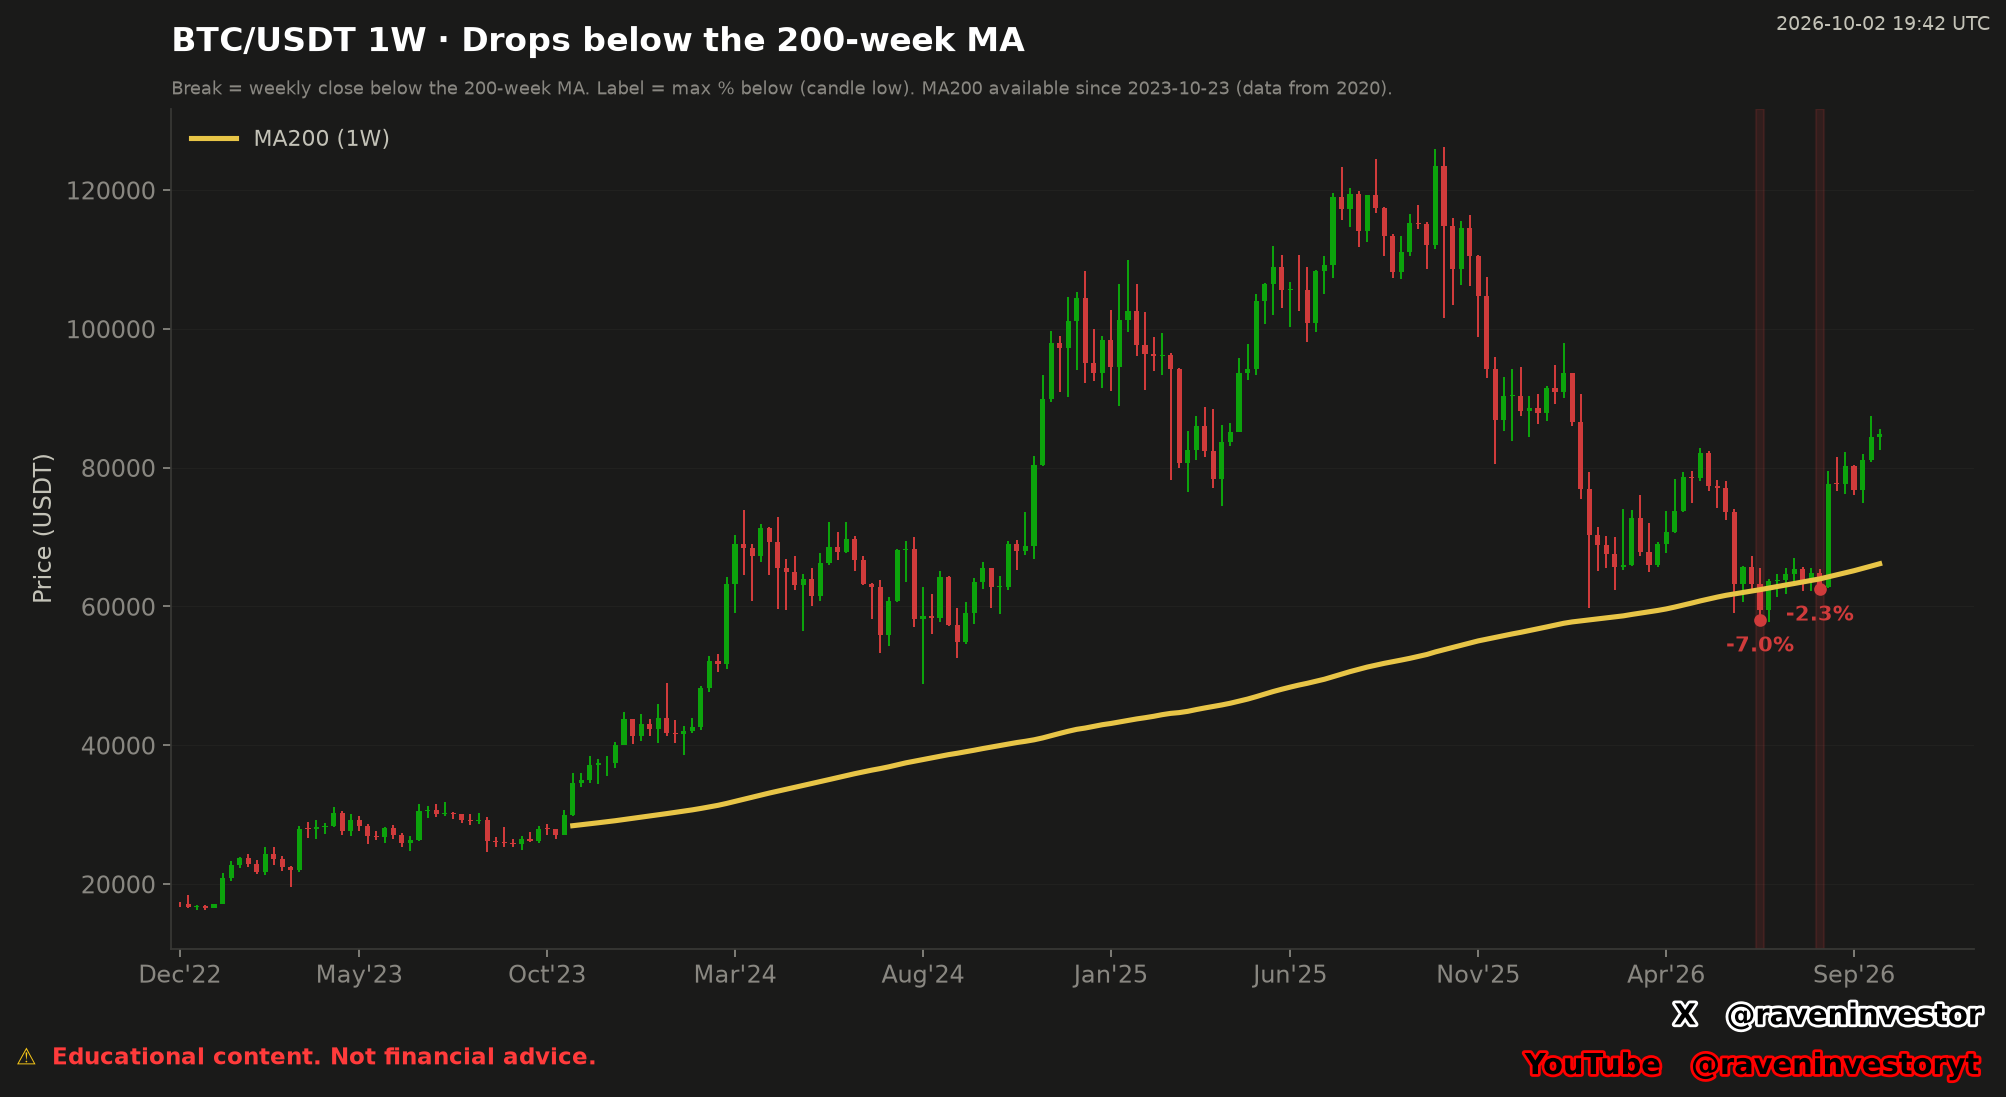
The report identifies two episodes in which BTC/USDT weekly closes were below the 200-week simple moving average. The deeper episode belongs to the week opening June 22, 2026: its candle low was 58,030.00 USDT and its maximum depth below the corresponding MA200 was -7.04%. The second belongs to the week opening August 10, 2026, with a low of 62,484.20 USDT and a depth of -2.34%.
In this two-episode sample, each episode lasted one qualifying week. The reported longest duration is one week and the reported average is 1.0 week. These durations count consecutive weekly closes below the average; they do not measure every hour spent beneath it.
The report also states that price is above MA200 at the data cutoff. That is a snapshot observation, not confirmation that the latest week has closed above the line or that the line will hold in the future.
How to read the chart
The upper title specifies the weekly timeframe, 1W. The candles display price in USDT, while the yellow line is the 200-week simple moving average. The red shaded bands mark the episodes selected by the weekly-close rule. They are not a record of every intraweek excursion below the line.
The red labels -7.0% and -2.3% are rounded chart versions of the report’s -7.04% and -2.34%. The associated dots identify the lows used to show the depth of those episodes. A label therefore answers how far a candle low fell beneath its corresponding moving average, not how much Bitcoin lost from a previous peak.
The yellow line starts later than the visible price series because the calculation needs 200 weekly observations. The report places the first available MA200 at October 23, 2023. Earlier candles provide context but cannot be classified by this study’s break rule while that average is unavailable.
Historical comparison: a sample of two episodes
The table transcribes the complete episode list in the supplied report. Dates identify the opening Monday at 00:00 UTC, not the time of the candle low or the moment a weekly close became final. With only two identified episodes, the comparison is descriptive.
| From / through (UTC) | Weeks | Maximum depth below MA200 | Low (USDT) |
|---|---|---|---|
| 2026-06-22 / 2026-06-22 | 1 | -7.04% | 58,030.00 |
| 2026-08-10 / 2026-08-10 | 1 | -2.34% | 62,484.20 |
The June episode was deeper than the August episode, while their reported durations were equal. That is the supported contrast. The report provides no standardized post-break returns, recovery-time series or trading costs, so this comparison cannot establish a profitable strategy or a probability of rebound.
The sample is two episodes from the period with a calculable MA200, not the full history of Bitcoin. Historical similarity does not guarantee the same future outcome.
Source, calculation and coverage
The declared source is Binance USD(S)-M BTCUSDT perpetual-futures aggTrades. Our own system constructs candles through the chain aggTrades → 1 second → 1 minute → 4 hours / 1 day / 1 week. The report states that 3,386,930,944 aggTrades were processed, covering 2,466 complete market days.
The weekly series runs from the opening date December 30, 2019, through September 28, 2026, and contains 353 candles. Weekly dates are opening labels; the report describes the underlying market history as beginning in 2020. Complete input days should not be confused with complete weekly candles.
MA200 is a simple average of 200 weekly closing values. A break is an episode of consecutive weekly closes below that average. For each qualifying candle, depth is defined as (candle low − MA200) / MA200, expressed as a percentage; the most negative reading is reported for the episode. These are the supplied definitions, not new calculations performed for this article.
A wick below MA200 without a weekly close below it does not count. Episodes separated by one week above the average are counted separately. The distinction matters: changing the event definition would change what is being studied.
The data is frozen through October 1, 2026; the report and chart were generated October 2, 2026, at 19:42 UTC. The week opening September 28 was still incomplete at that cutoff. We therefore do not treat the latest price-above-MA200 observation as a confirmed weekly-close result.
Interpretation and limits
Our interpretation is that this study is most useful as an explicit record of how weekly-close breaks were identified and how deeply their candles extended below the average. It separates event detection, episode duration and candle-low depth instead of treating them as interchangeable measures.
The two observed episodes do not show that MA200 caused the subsequent price path. Nor does a one-week episode establish that the market was below the average only briefly within that week. Weekly aggregation and the close-based rule answer a narrower question.
Coverage is a central limitation: MA200 is available only from October 23, 2023 in this dataset. Earlier periods without a calculable average are excluded, not evidence of an absence of breaks. The chart and report also do not supply an exact current MA200 price, so no current numeric support level or trading target is inferred.
The conclusion is limited to two qualifying episodes and the reported snapshot. A moving average remains a historical reference, not a guarantee of support or a recommendation to buy or sell.
Sources and data fingerprint
Source archive declared by the supplied report: Binance USD(S)-M BTCUSDT daily aggTrades. The figures above are transcribed from that report; this article does not independently reprocess the archive. View the Binance archive.
Data fingerprint declared by the report: ed509b060f2daa27. This identifier distinguishes the supplied data version; displaying it is not a substitute for independent verification.