Independent quantitative research

See the market event.
Understand the evidence.

RavenInvestor turns structured market signals into clear, carefully sourced analysis—without hype or prediction theater.

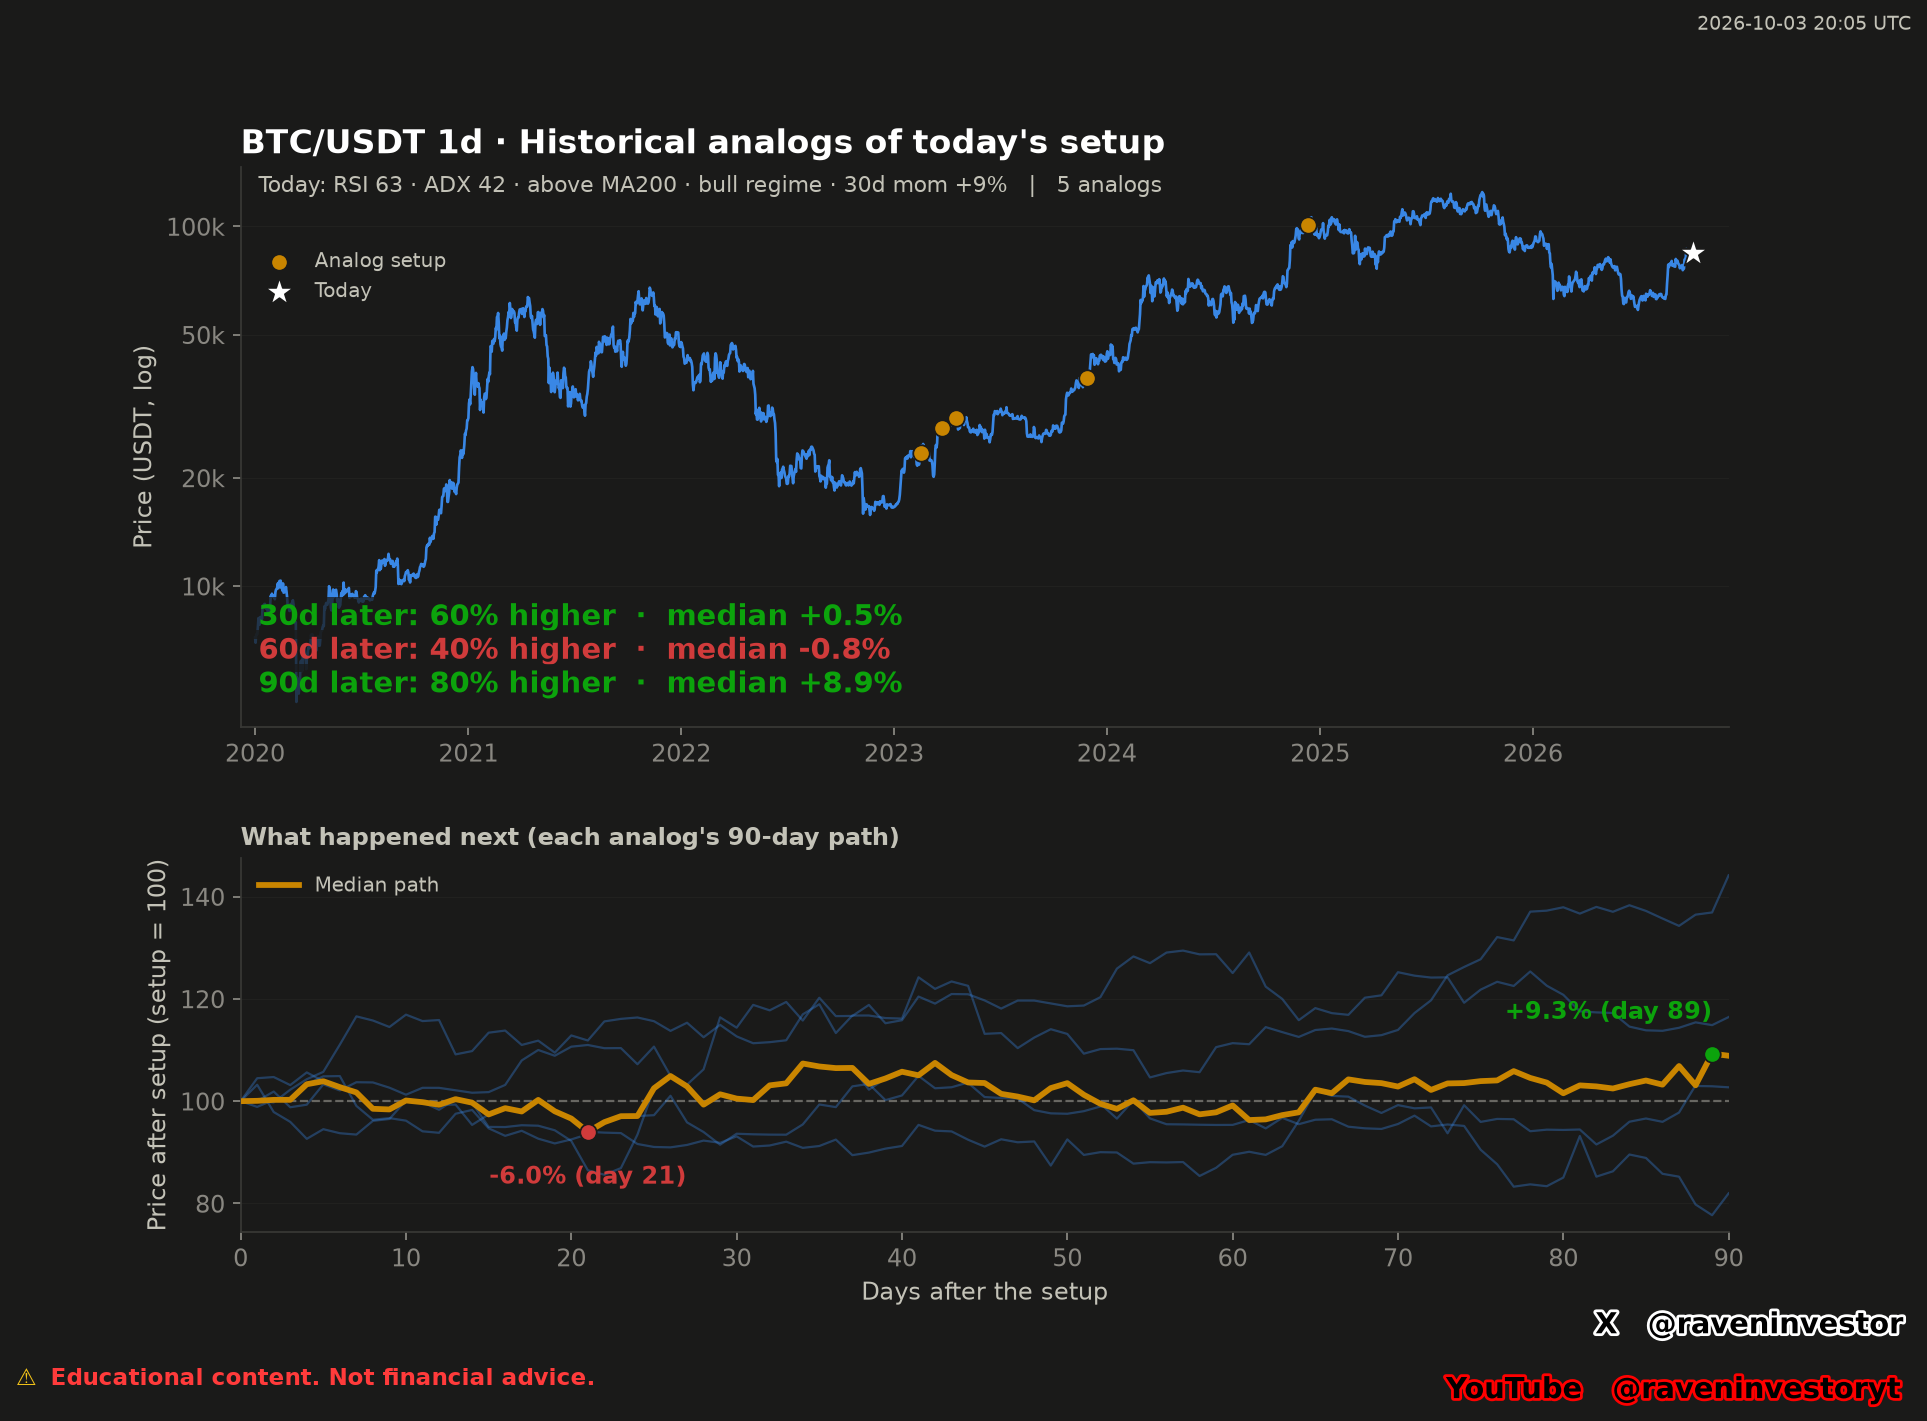
BTC/USDT daily history with five orange analog markers and the current setup in white; below, five normalized 90-day paths and an orange median path.

Bitcoin’s five historical analogs show different outcomes by horizon

Among five matched episodes, three were higher after 30 days and four after 90 days. The medians were +0.5% and +8.9%, but the individual paths included losses: this is a small historical comparison, not a forecast.

Read the analysis

Latest analysis

One event, fully examined.

View the archive →
Oct 2
2026
Bitcoin below the 200-week MA: two episodes, different depthsTechnical analysis
Sep 26
2026
Inflation in nine countries: cumulative totals and recent monthly paceMacroeconomics
Sep 19
2026
BTC/USDT: 27,632 Captured Liquidations, Not a Market-Wide TotalDerivatives
Sep 15
2026
BTC/USDT Weekly Moving Averages Spread From $65,463.55 to $89,367.98Technical indicators
Sep 14
2026
BTC/USDT Weekly Chart Maps $75,999.60 Support and $80,600.00 ResistanceMarket structure
Sep 7
2026
BTC/USDT Volatility Peaks at 14:00 UTC in the Supplied 90-Day SampleVolatility analysis
Sep 2
2026
BTC/USDT Historical Analog Search Finds One Prior MatchHistorical analysis

Our standard

Evidence before narrative.

Observed dataClearly separated from interpretation.

Reproducible methodsSources, timestamps, assumptions, and limitations.

No certainty claimsNo personalized advice and no guaranteed outcomes.

RavenInvestor Learn

Understand the tools behind the analysis.

Explore all guides →

Built to compound

Every important event becomes historical evidence.

RavenInvestor preserves significant market events as durable case studies. As the archive grows, future analysis can compare new conditions with transparent historical samples instead of relying on memory or generic commentary.

Read our methodology