A positive position result alongside a negative price change
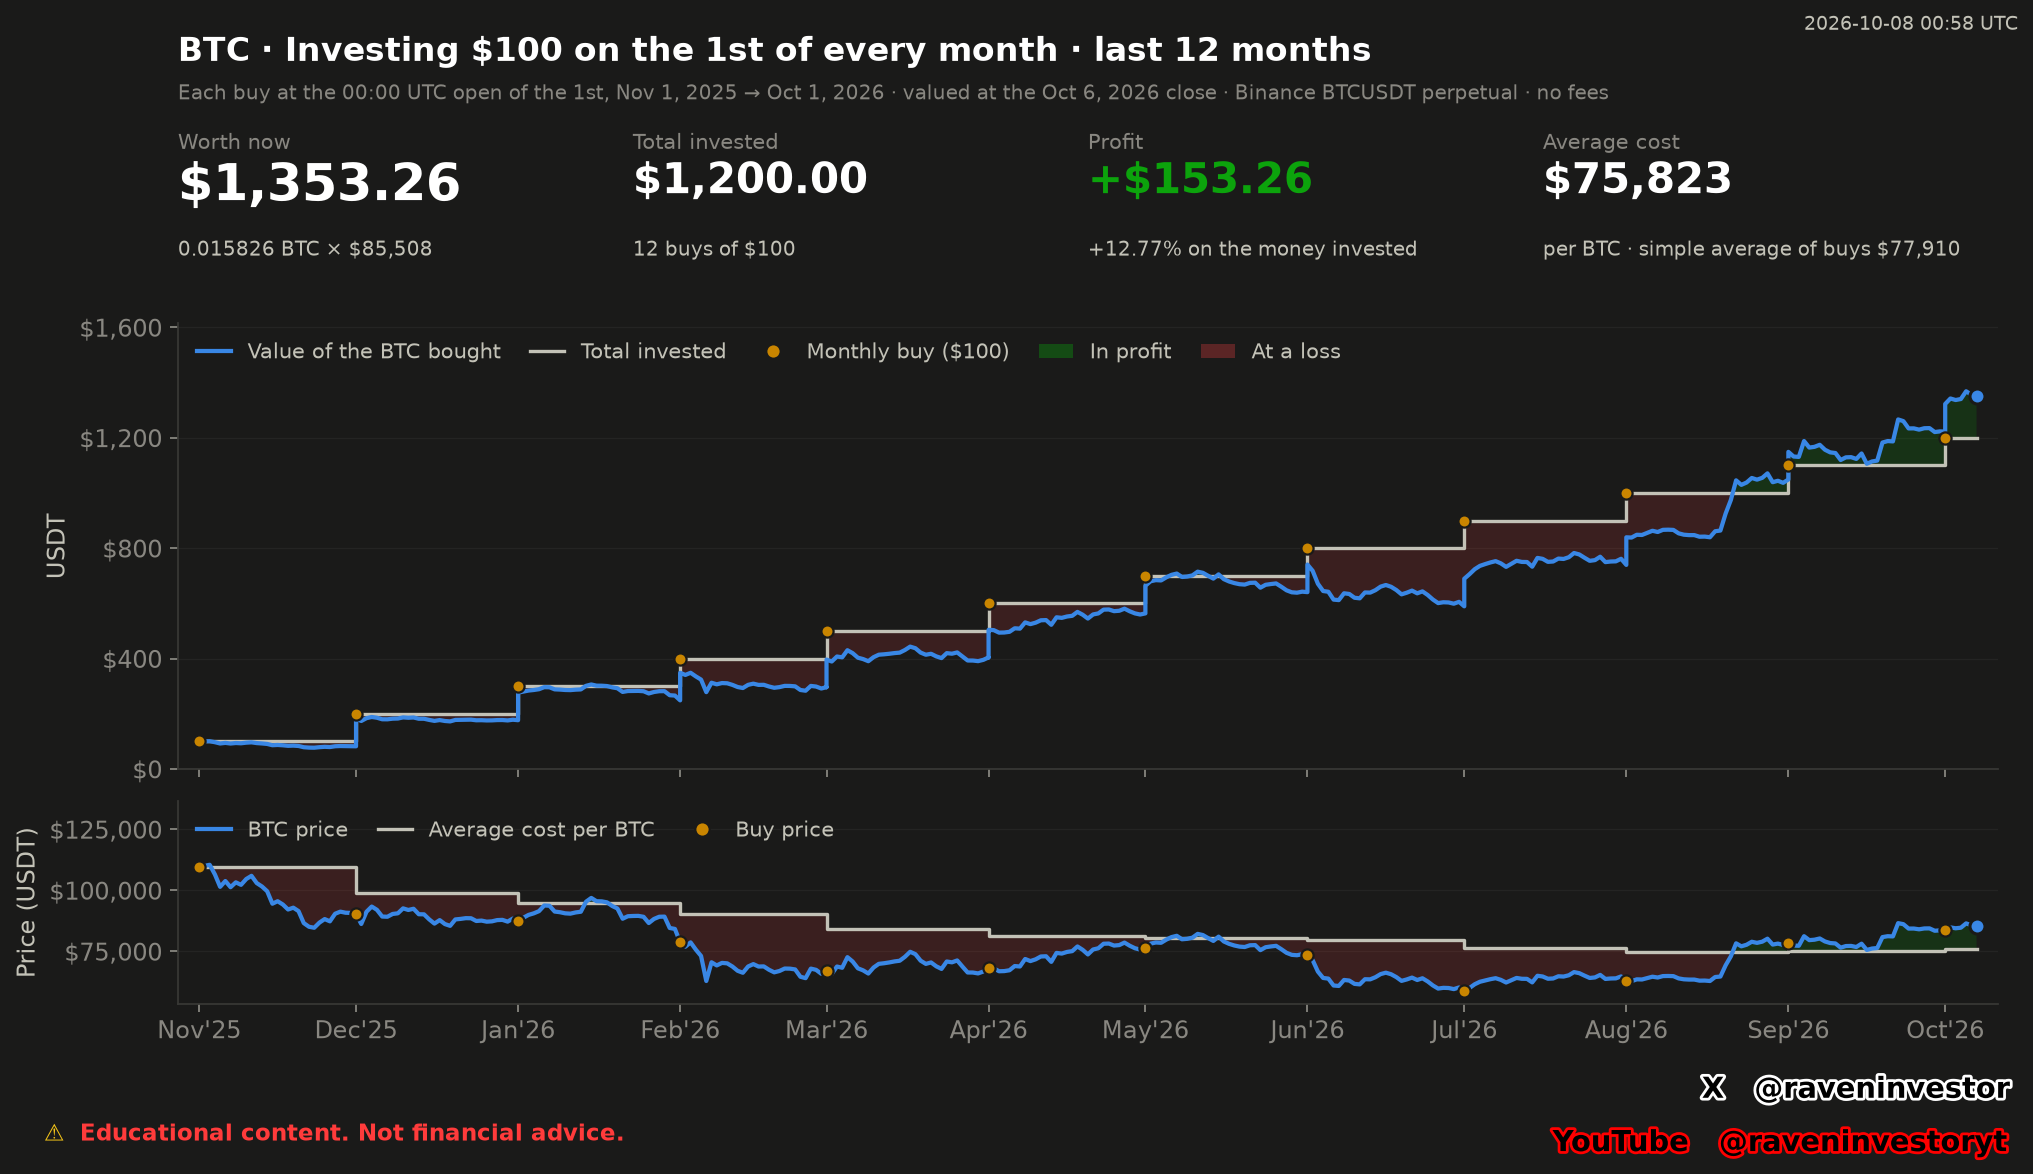
The supplied report simulates investing 100.00 USDT at the daily opening, 00:00 UTC, on each first day of the month from November 2025 through October 2026. Its 12 purchases accumulated 0.01582624 BTC. At the October 6, 2026 close of 85,507.50 USDT, the reported value was 1,353.26 USDT against 1,200.00 USDT contributed: a gain of 153.26 USDT, or 12.77%, before costs.
In this one 340-candle window, the report also states that BTC’s reference price fell 21.95% from the first purchase price of 109,557.20 USDT. The figures answer different questions: the price change compares two endpoints, while the position result includes purchases made at different prices and times. The full contribution was not present from the first day.
Interpretation: the simulated accumulated position ended above its cost even though the reference price ended below its initial observation. This does not establish that monthly purchases generally outperform holding, nor that another purchase schedule or valuation date would produce the same result.
The two panels separate contributions, value and price
In the upper panel, the blue line values all BTC bought up to each daily close. The light stepped line tracks cumulative contributions, and orange dots mark the monthly purchases. Green shading indicates value above contributions; red indicates value below them. A new contribution increases the BTC balance as well as the money committed: an upward step in value is not automatically a profit.
The lower panel plots the BTC price in blue, average cost per BTC in the light line and individual purchase prices as orange dots. It is not a second portfolio-value chart. Its final average-cost reference is 75,823.45 USDT per BTC, whereas the common closing valuation is 85,507.50 USDT.
The cards summarize the endpoint, not every earlier daily result. Their 0.015826 BTC balance and prices of $85,508, $75,823 and $77,910 are rounded presentations of the more precise report values. The axes and report use USDT despite the dollar symbols in the image; no conversion to USD is supplied.
Why average cost differs from the simple average price
For this sample of 12 purchases, the report gives a position average cost of 75,823.45 USDT per BTC and a simple average of purchase prices of 77,910.11 USDT. It states that the former is 2.68% lower. That comparison is supplied by the report, not newly calculated here.
The contribution stays at 100.00 USDT, but the purchased BTC quantity changes. July 1 supplied the most BTC: 0.00170633 BTC at 58,605.40 USDT. November 1 supplied the least: 0.00091277 BTC at 109,557.20 USDT. Under the declared method, lower-priced purchases acquire more BTC and carry more quantity weight in the position’s cost.
Average cost is total contributions divided by accumulated BTC; the simple average treats purchase prices equally. They should not be interchanged. Neither is a technical support, resistance or future price target. The report supplies no technical-level study, so no support/resistance section is inferred from these accounting references.
Twelve purchases, one common valuation close
Each row below uses the same contribution of 100.00 USDT. Its result column is the reported price change from that purchase to the October 6 close, not the row’s contribution to the portfolio’s total percentage gain. All quantities and cumulative values are transcribed from the report; adding displayed, rounded BTC quantities can differ in the final decimal from the reported accumulated balance.
| Purchase date (UTC) | Price per BTC (USDT) | BTC bought | BTC accumulated | Contributions (USDT) | Result at valuation |
|---|---|---|---|---|---|
| 2025-11-01 | 109,557.20 | 0.00091277 | 0.00091277 | 100.00 | -21.95% |
| 2025-12-01 | 90,320.50 | 0.00110717 | 0.00201993 | 200.00 | -5.33% |
| 2026-01-01 | 87,608.30 | 0.00114144 | 0.00316138 | 300.00 | -2.40% |
| 2026-02-01 | 78,706.70 | 0.00127054 | 0.00443192 | 400.00 | +8.64% |
| 2026-03-01 | 66,937.00 | 0.00149394 | 0.00592586 | 500.00 | +27.74% |
| 2026-04-01 | 68,241.40 | 0.00146539 | 0.00739125 | 600.00 | +25.30% |
| 2026-05-01 | 76,305.40 | 0.00131052 | 0.00870177 | 700.00 | +12.06% |
| 2026-06-01 | 73,653.20 | 0.00135771 | 0.01005948 | 800.00 | +16.09% |
| 2026-07-01 | 58,605.40 | 0.00170633 | 0.01176581 | 900.00 | +45.90% |
| 2026-08-01 | 62,859.80 | 0.00159084 | 0.01335665 | 1,000.00 | +36.03% |
| 2026-09-01 | 78,549.60 | 0.00127308 | 0.01462973 | 1,100.00 | +8.86% |
| 2026-10-01 | 83,576.80 | 0.00119650 | 0.01582624 | 1,200.00 | +2.31% |
At this common endpoint, the report classifies nine of the 12 purchases as profitable and three as loss-making. The November purchase remains at -21.95%, while July’s is at +45.90%. A profitable combined position does not mean every purchase is profitable. These are modeled valuations, not profits collected through documented sales.
Historical comparison: the daily path inside one window
Among the 340 daily observations, the report identifies September 21, 2026 as the best closing percentage result: +15.15%, with a value of 1,266.62 USDT against 1,100.00 USDT contributed. Its worst close was February 5, 2026: -30.34%, with a value of 278.63 USDT against 400.00 USDT contributed.
Those percentages use the contributions accumulated on each date, which changed as purchases were added. They are not a reported peak-to-trough drawdown, and the best percentage day need not be the highest absolute portfolio value. The final +12.77% cannot describe that earlier loss exposure on its own.
Interpretation: the final profit and the negative earlier readings are compatible parts of the same simulation. The sample is one window with 12 purchases, not 12 independent strategy tests. Historical similarity does not guarantee the same future outcome. No result from a different valuation date is used to rank this strategy against the separate fixed-BTC study.
Methodology and risk
The report was generated October 8, 2026 at 00:58 UTC, with a frozen data cutoff at October 6. The study covers November 1, 2025–October 6, 2026 and 340 daily candles. Its twelve-month label means the last 12 first-of-month purchase dates with data, not twelve fully elapsed months after the initial purchase.
The declared source is Binance USD(S)-M BTCUSDT perpetual-futures aggTrades. Our own system constructs candles through aggTrades → 1 second → 1 minute → 4 hours / 1 day / 1 week. The report declares 3,386,930,944 processed aggTrades and 2,471 complete market days for broader source coverage; these are not the sample size of this purchase study.
Purchased BTC is the contribution divided by its opening price. Daily value is accumulated BTC multiplied by that day’s close. The result compares value with contributions; average cost divides contributions by accumulated BTC. This article transcribes the supplied results without new financial calculations. The 12.77% is not an annualized return.
No real orders occurred. Commissions, spread and slippage are absent, and BTC quantities are not rounded to exchange minimum lot sizes. The report warns that perpetual and spot prices can differ, and that different purchase times or valuation dates change results. Margin, leverage, funding and contract execution are not documented here, so this is not a complete perpetual-trading performance record or evidence of BTC held in a wallet.
Sources and data fingerprint
Sources: supplied RavenInvestor report and original chart, October 8, 2026, 00:58 UTC; underlying Binance USD(S)-M BTCUSDT perpetual aggregate-trade archives. The original exchange records were not independently reprocessed for this article. Binance public archives.
Data fingerprint declared by the report: 7cce4497d5376c5d. Identifies the supplied data version; it is not an independent audit or proof of real trades.