A bull regime is a classification, not a forecast
The October 21 snapshot puts BTC/USDT above its daily MA200, with RSI(14) at 56.8, ADX(14) at 19.5 and 30-day momentum of −2.9%. The report also supplies a position-in-range value of 0.57. Its bull-regime label comes from the relationship between MA50 and MA200, whereas price above MA200 is a separate matching condition.
A negative 30-day move and a bull-regime label are therefore not contradictory: they describe different features of the same observation. Neither the label nor the price’s position above MA200 establishes what happens next. Here they are filters used to find comparable historical setups.
The search finds 58 matching days and groups nearby observations into 14 episodes. The comparison sample is 14 episodes, not 58 independent cases. Consolidation reduces repeated counting of nearby matches, but does not establish statistical independence between the remaining episodes or eliminate overlap between their subsequent paths.
How to read both panels
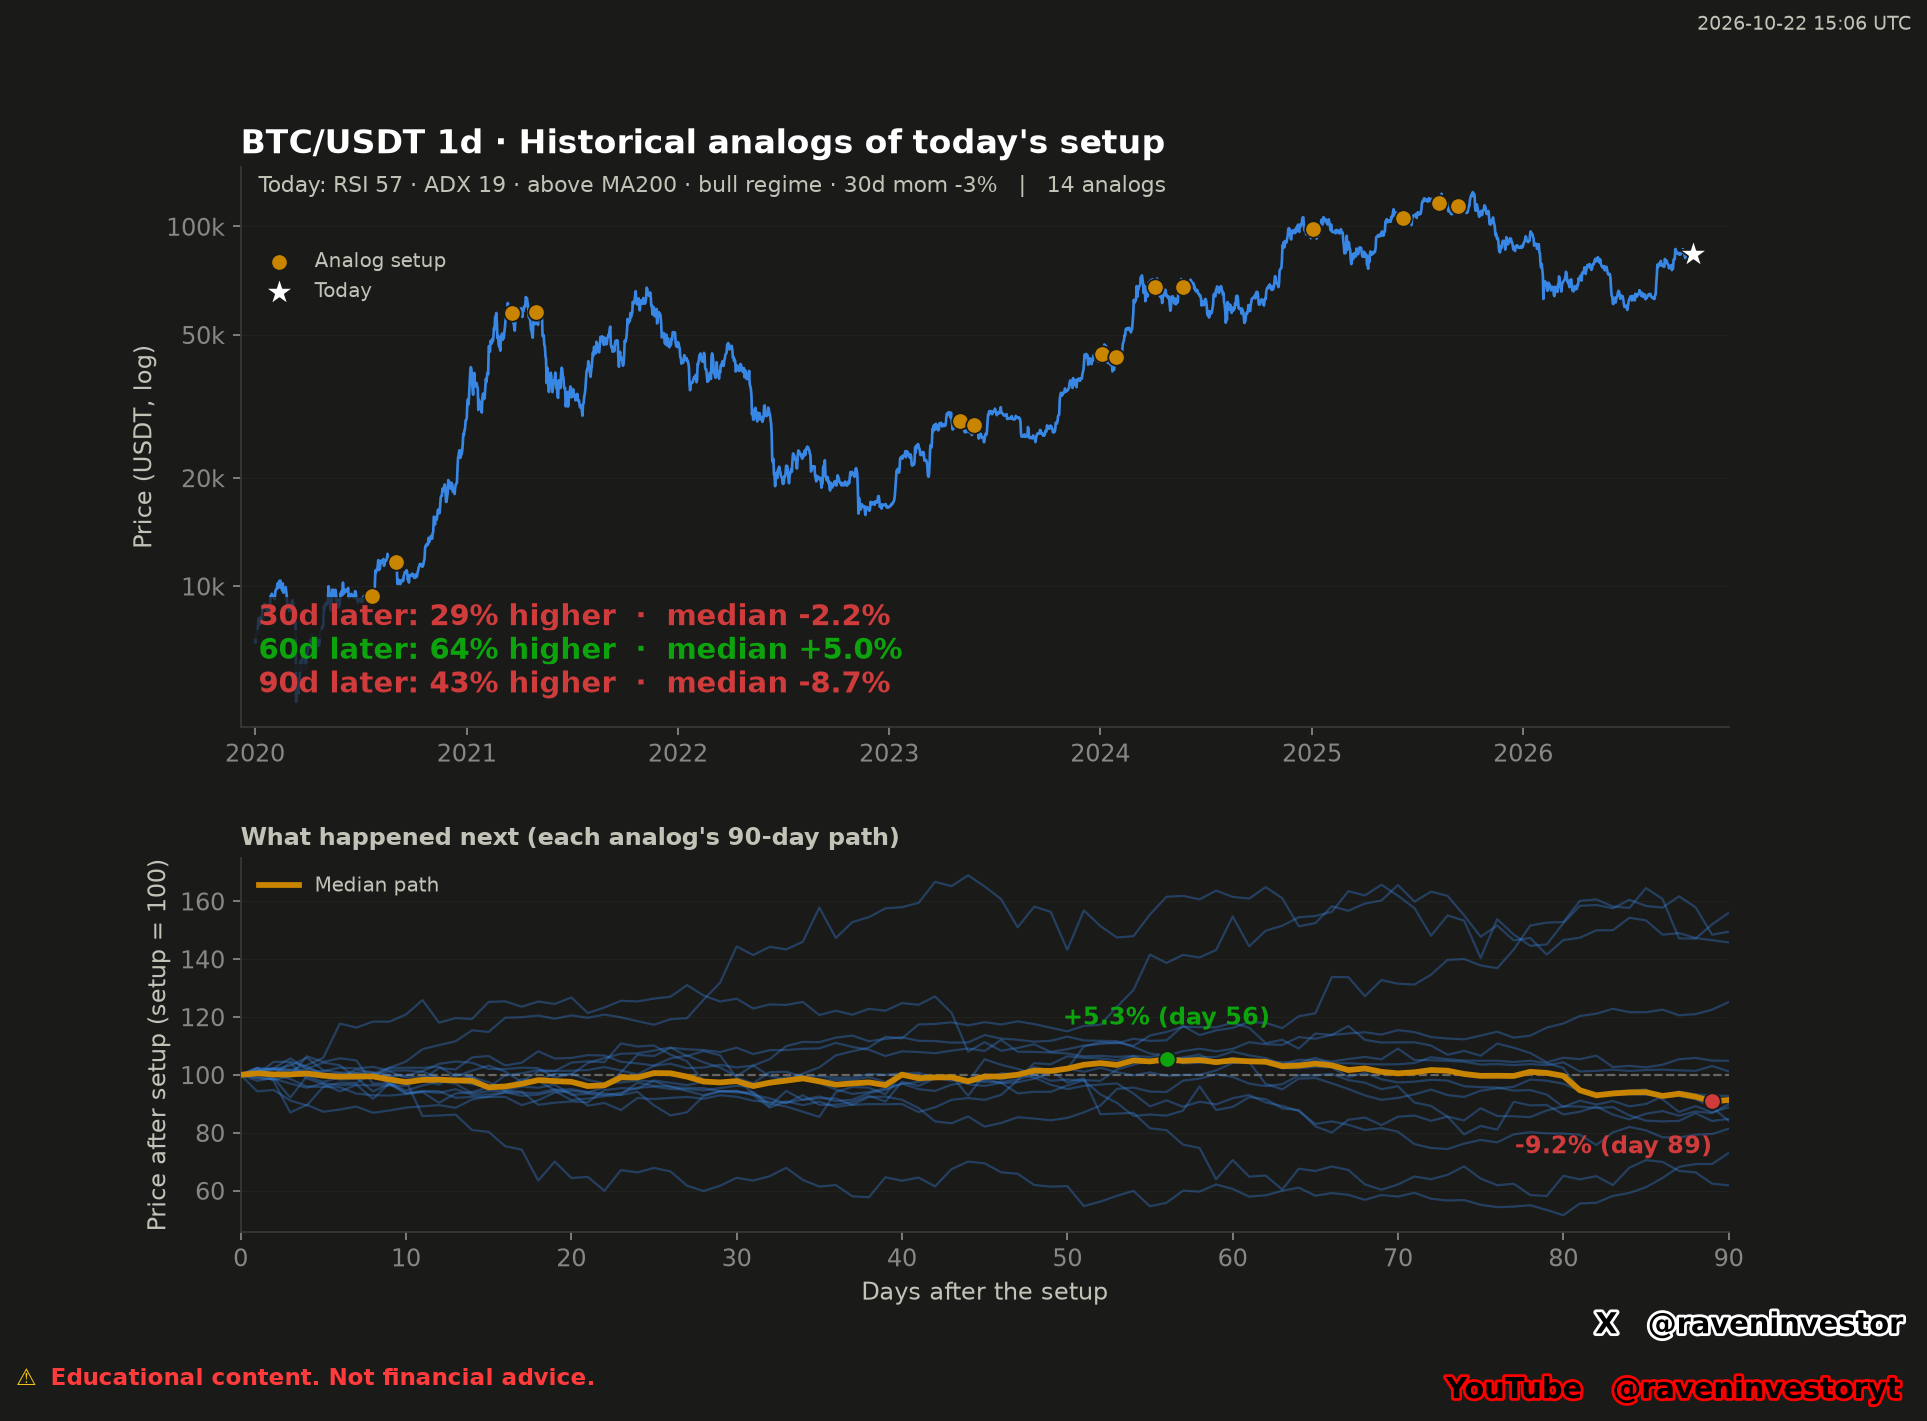
The upper panel places 14 orange anchors on BTC/USDT daily price history; the white star marks the current snapshot. The price axis is logarithmic. “Today” refers to the frozen October 21 observation, not a live quote. The chart header uses integer labels—RSI 57, ADX 19 and momentum −3%—while the report gives 56.8, 19.5 and −2.9%. We retain the report’s precision; the label-formatting rule is not supplied.
The lower panel resets each of the 14 episodes to 100 at its anchor. Thin blue lines show individual paths over 90 days. The dashed baseline represents each episode’s starting price, not a common BTC price in USDT. The orange line is the median at each day, not one episode or an executed strategy.
For these 14 episodes, the median path is annotated at +5.3% on day 56 and −9.2% on day 89. These points are not the best gain and worst loss among individual cases. They also are not the endpoint summaries: the 60-day median is +5.0%, and the 90-day median is −8.7%. Different days answer different questions.
The image reports that 64% of the 14 episodes were higher at 60 days. That summary and its +5.0% median come from the chart; the TXT does not list individual 60-day outcomes. We do not reconstruct those missing values. The wider spread of blue paths also matters: the median does not describe every episode’s experience.
Historical comparison: all 14 supplied episodes
The table transcribes the 14 anchor dates and their supplied price changes at seven, 30 and 90 days. Dates refer to candle openings in UTC. These are subsequent price variations, not net returns from a specified trading strategy: execution rules and costs are not supplied.
| Anchor date (UTC) | After 7 days | After 30 days | After 90 days |
|---|---|---|---|
| 2020-07-21 | +16.3% | +26.3% | +25.1% |
| 2020-08-31 | −11.0% | −7.6% | +56.0% |
| 2021-03-21 | −2.8% | −1.7% | −38.2% |
| 2021-05-01 | +1.9% | −35.6% | −27.0% |
| 2023-05-04 | −6.5% | −6.1% | +1.2% |
| 2023-05-28 | −3.4% | +9.4% | −7.3% |
| 2024-01-04 | +5.0% | −2.6% | +49.4% |
| 2024-01-29 | −1.4% | +44.4% | +45.7% |
| 2024-04-05 | −1.0% | −5.7% | −15.9% |
| 2024-05-23 | +0.6% | −5.5% | −10.1% |
| 2025-01-03 | −3.5% | −0.5% | −15.2% |
| 2025-06-07 | −0.1% | +2.6% | +4.8% |
| 2025-08-09 | +0.8% | −3.8% | −11.3% |
| 2025-09-10 | +2.2% | −1.0% | −18.7% |
At seven days, six of the 14 episodes were higher (43%). The reported median is −0.6%, the mean is −0.2%, and the range is −11.0% to +16.3%. Those figures describe this selected sample, not the probability of a gain next week.
At 30 days, four of 14 episodes were higher (29%). The median is −2.2%, but the mean is +0.9%, with outcomes ranging from −35.6% to +44.4%. The May 1, 2021 anchor and January 29, 2024 anchor supply the listed extremes. The opposite signs of mean and median show why a positive average alone would give an incomplete account of these 14 cases.
At 90 days, six of 14 episodes were higher (43%). The median is −8.7%, while the mean is +2.8%; the supplied range is −38.2% to +56.0%. The March 21, 2021 case supplies the lowest endpoint and August 31, 2020 the highest. The latter was negative at seven and 30 days before finishing positive at 90 days.
Our interpretation of these 14 episodes is that neither a positive mean nor the positive 60-day median supports a single directional conclusion. The negative medians at 30 and 90 days coexist with large positive outcomes in some cases. Historical similarity does not guarantee the same future outcome.
Source, matching method and what can be verified
The declared source is Binance USD(S)-M BTCUSDT perpetual-futures aggTrades. Our own system constructs candles through aggTrades → 1 second → 1 minute → 4 hours / 1 day / 1 week. The report states 3,386,930,944 processed aggTrades and 2,486 complete daily candles from January 1, 2020 through October 21, 2026. That is the history searched, not the 14-episode comparison sample.
The matching fingerprint combines RSI(14), ADX(14), side of MA200, the MA50-versus-MA200 regime, 30-day momentum and position within a range. Side of MA200 and regime must match exactly; other features use indicator-specific tolerances. Recent days are excluded, nearby matches are grouped and subsequent changes are summarized by horizon.
The report does not give numerical tolerances, the recent-day exclusion interval, grouping distance, range lookback or exact anchor-selection rule. It also does not fully specify indicator implementation. The Binance archive identifies provenance, but the summary alone cannot reproduce the exact search. We transcribe supplied results rather than claim an independent recalculation.
The frozen cutoff is October 21, 2026; the report and image were generated October 22, 2026 at 15:06 UTC. No new financial calculations were performed for this article. The data fingerprint below records the identifier supplied with this version.
Limits of the conclusion
Fourteen selected episodes form a small descriptive case study, not a validated predictive probability. Their selection depends on the chosen indicators and tolerances, and history begins in 2020 rather than covering earlier Bitcoin cycles. Similarity is not evidence that the matched indicators caused later movements.
No exact current price, numerical MA200, support or resistance is supplied. There are therefore no price levels to infer from the chart. The supported conclusion is narrower: 14 past episodes shared the selected characteristics, but their outcomes differed substantially across cases and horizons.
Sources and data fingerprint
Sources: the supplied RavenInvestor report and image, generated October 22, 2026 at 15:06 UTC; underlying source declared as Binance USD(S)-M BTCUSDT daily aggTrades. This article does not independently reprocess the archive. View the Binance archive.
Data fingerprint declared by the report: 3cdae56ea3a15e8e. This is the supplied data-version identifier, not a certification of predictive accuracy or a replacement for independent verification.