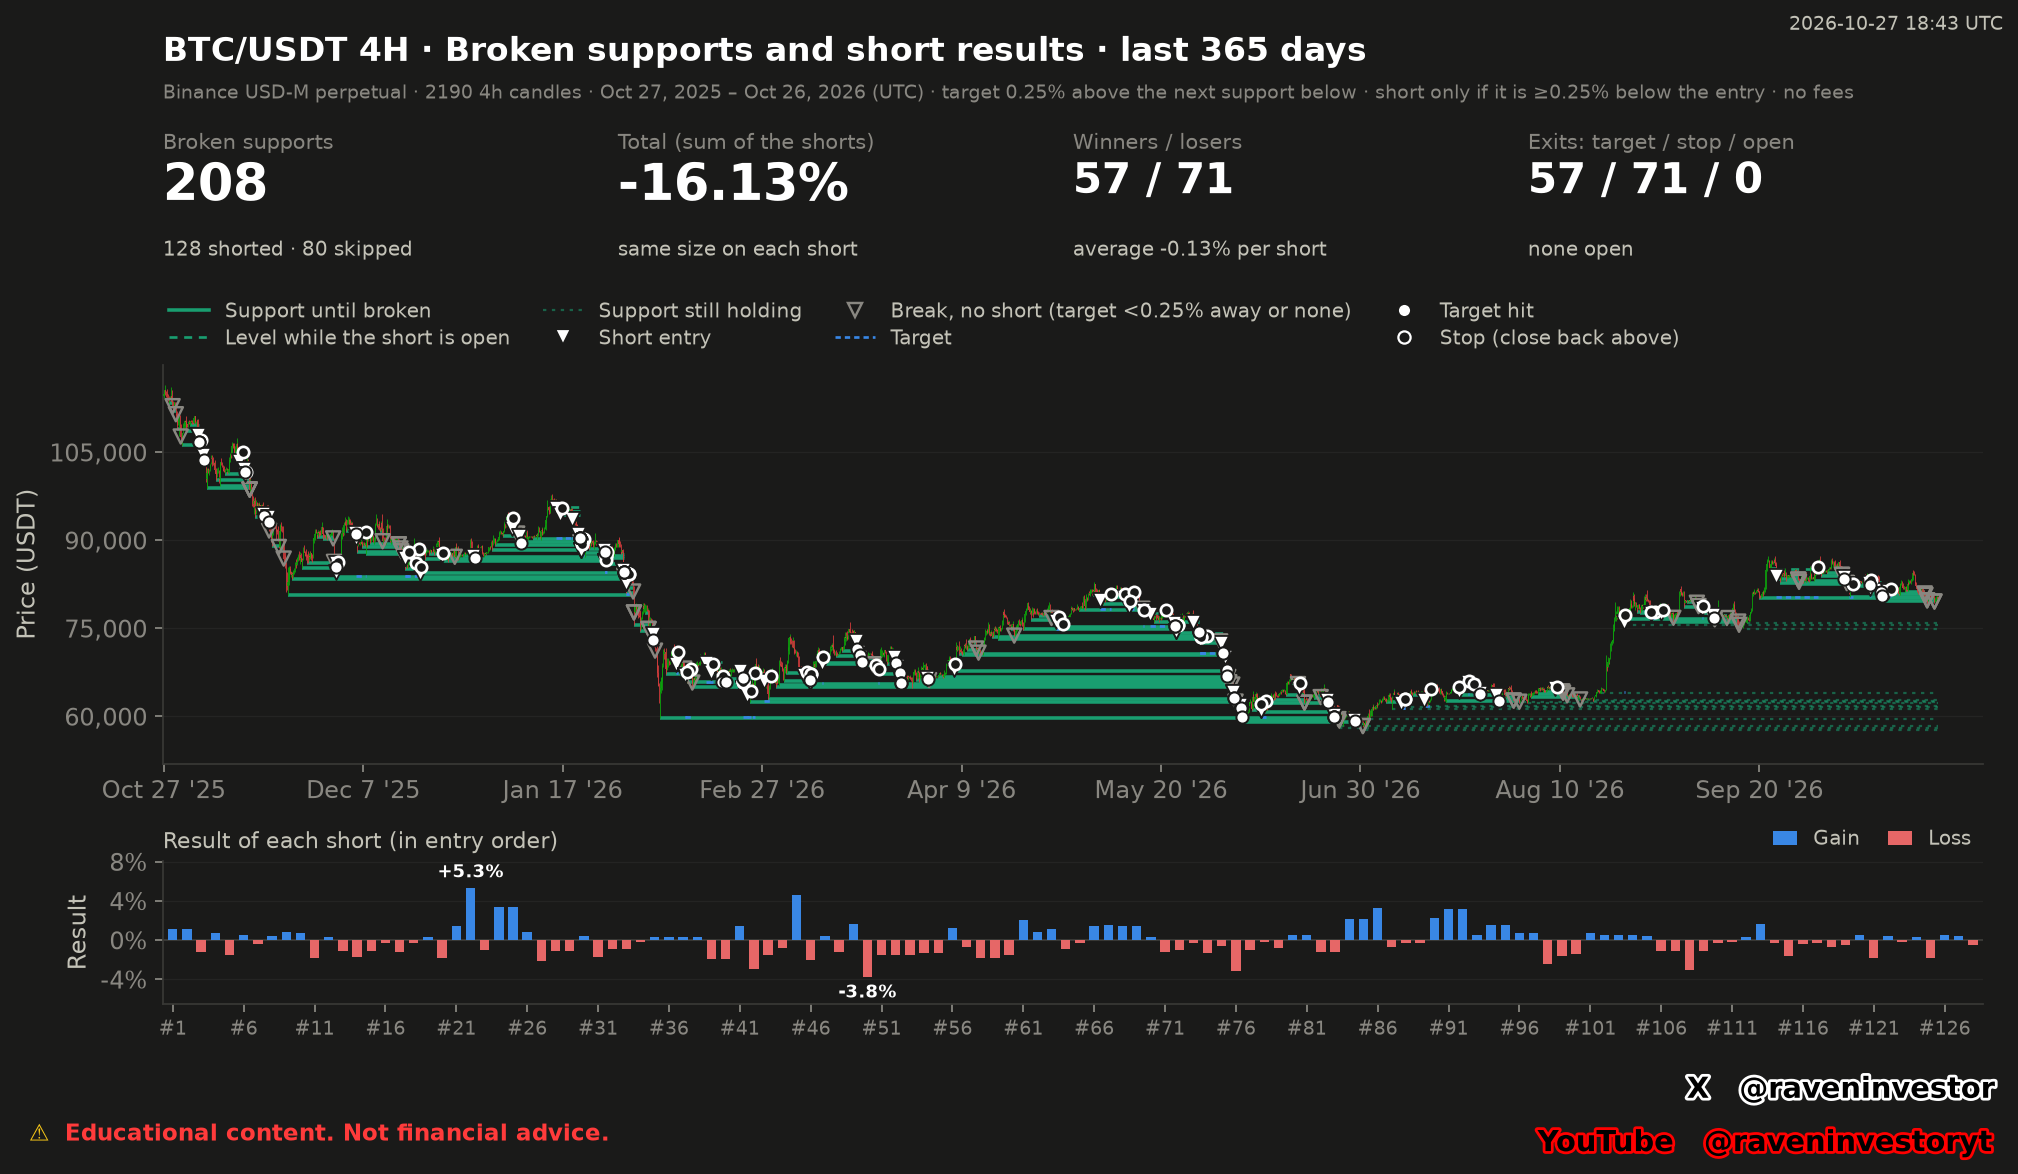
Observed result: the specified rule finishes negative
The study detects 224 supports in its 365-day window. Of these, 208 subsequently have a four-hour close below the confirmed level, while 16 remain unbroken at the cutoff. A break alone does not trigger every short: the target filter admits 128 trades and excludes 80 breaks.
Among the 128 simulated shorts, 57 exit at their targets and 71 at a closing-price stop. No positions remain open. Target exits contribute a reported +69.95% to the sum, while stop exits contribute -86.08%. The resulting sum is -16.13%, with an average of -0.13% per short.
Interpretation: identifying a broken support was not enough for this particular entry-and-exit rule to produce a positive result in this sample. This is evidence about the supplied simulation, not a verdict on every short strategy or a forecast for Bitcoin.
How to read the price panel and the result bars
The upper panel places the four-hour price candles against horizontal support references. Solid green lines show supports until broken. Dotted green lines identify supports still holding under the study’s closing-price rule. Dashed green segments track the broken level while its short remains open; a wick through a level is not the same as a confirmed closing break.
White downward triangles mark short entries. Hollow gray triangles mark breaks without a trade, either because the target fails the minimum-distance rule or because no lower support exists. Blue dashed segments mark targets. Filled white circles identify target exits, while hollow white circles identify exits when a candle closes back above the broken support.
The lower panel shows each of the 128 short results in entry order: blue bars for gains and red bars for losses. It is not an account-equity curve and its horizontal spacing is not calendar time. The highlighted +5.3% and -3.8% are rounded chart labels for the report’s +5.28% and -3.80% extremes.
Why 80 breaks do not become shorts
The model identifies local lows, waits for confirmation and groups nearby lows into an average support level. The report states that a support becomes tradable two candles, or eight hours, after its low. Entry is at the close of the first candle that closes below that confirmed support, with only one short permitted per support.
At entry, the target is placed 0.25% above the next lower active support. Candidate target supports can come from the study window or the preceding 90 days. The short is accepted only if that target lies at least 0.25% below the entry price. These are separate conditions: one offsets the target from a support, and the other checks its distance from entry.
Of the 80 excluded breaks, 70 fail the target-distance requirement and 10 have no lower support. Some excluded targets are even above the prospective entry, so a visible break is not automatically a usable target setup. The target stays fixed after entry, even if a new support later appears closer.
The simulation counts a target exit when a subsequent candle’s low reaches the target. Otherwise, it exits at the first close back above the broken support. Within each candle the target is checked before the closing-price stop. This stop is not an intrabar protective order executed at the support price.
Historical comparison within the 128-trade sample
The 57 winners average +1.23%, compared with -1.21% for the 71 losers. The report gives an average time to target of 14 hours, with a median of four hours, and an average time to stop of 17 hours, with a median of eight hours. These comparisons cover the same 128 simulated trades in one 365-day window, not independent tests across multiple windows.
The table selects only two of the 128 trades: the best and worst reported outcomes. Trade #22 reaches its target for +5.28%; trade #50 exits at a stop for -3.80%. They illustrate the supplied extremes, not typical outcomes. Dates are candle-opening labels, even where execution uses that candle’s close.
The sample’s average maximum favorable move is reported as +0.99%, compared with -0.13% at exit. A favorable move during a position therefore must not be presented as a realized result. Historical similarity does not guarantee the same future outcome.
| Short | Support | Entry candle | Entry | Exit candle | Exit | Reason | Result | Hours |
|---|---|---|---|---|---|---|---|---|
| 22 | 95,733.10 | 2026-01-15 16:00 | 95,469.20 | 2026-01-20 12:00 | 90,425.43 | target | +5.28% | 116 |
| 50 | 66,408.10 | 2026-02-23 00:00 | 64,894.00 | 2026-02-25 12:00 | 67,362.30 | stop | -3.80% | 60 |
Why -16.13% is not an account return
The headline figure adds each short’s percentage result using the same amount per trade. Several supports can break in the same candle, opening several shorts at the same entry price. For example, trades #1 and #2 both enter at 107,886.00 USDT on the candle labeled November 3, 2025 at 00:00 UTC, but correspond to different broken supports.
Those overlapping trades are included in the sum. The report does not provide a funded-account capital path, a portfolio allocation rule or a compounded return. Consequently, -16.13% cannot be translated into a percentage loss on an unspecified account balance. Nor are the 128 trades necessarily independent market episodes.
Levels to Watch: 16 unbroken supports at the cutoff
Against the final close of 80,115.90 USDT, the highest listed unbroken support is 79,309.80 USDT, formed from three grouped lows and reported at -1.01% from that close. The next listed references are 75,975.00, 75,588.00 and 74,967.20 USDT. The table preserves all 16 supplied levels and their reported distances.
These are historical references as of October 26, not live quotes or recommended orders. A level’s continued presence means the specified closing-break condition had not occurred by the cutoff; it does not guarantee a future bounce. Supports formed near the end of the window had less time to be tested.
| Support | Formed (UTC) | Grouped lows | Distance from close |
|---|---|---|---|
| 79,309.80 | 2026-10-24 12:00 | 3 | -1.01% |
| 75,975.00 | 2026-09-17 12:00 | 1 | -5.17% |
| 75,588.00 | 2026-08-23 04:00 | 1 | -5.65% |
| 74,967.20 | 2026-09-15 16:00 | 2 | -6.43% |
| 64,055.25 | 2026-08-18 12:00 | 2 | -20.05% |
| 62,872.90 | 2026-08-13 16:00 | 3 | -21.52% |
| 62,681.10 | 2026-08-16 20:00 | 1 | -21.76% |
| 62,447.35 | 2026-07-31 12:00 | 2 | -22.05% |
| 62,248.50 | 2026-08-01 16:00 | 2 | -22.30% |
| 61,806.00 | 2026-07-13 16:00 | 1 | -22.85% |
| 61,593.00 | 2026-07-08 12:00 | 2 | -23.12% |
| 61,297.00 | 2026-07-06 12:00 | 1 | -23.49% |
| 59,555.00 | 2026-07-02 00:00 | 1 | -25.66% |
| 58,323.37 | 2026-06-26 00:00 | 3 | -27.20% |
| 58,095.00 | 2026-06-25 12:00 | 2 | -27.49% |
| 57,758.60 | 2026-07-01 00:00 | 1 | -27.91% |
Methodology and risk: what the simulation leaves unresolved
Our own system constructs candles from Binance BTCUSDT USD(S)-M perpetual aggregate trades: aggTrades to one-second candles, then one-minute candles and higher intervals. The report declares 3,386,930,944 processed aggTrades across 2,491 complete market days. This backtest selects 2,190 four-hour candles from October 27, 2025 at 00:00 through October 26, 2026 at 20:00 UTC, using opening-time labels and a frozen October 26 cutoff.
Commissions, funding and slippage are excluded. A touched limit price is counted as filled, although the report warns that a real order might not fill. The exact grouping tolerance and full local-low neighborhood parameters are not supplied, so this document alone is insufficient to reproduce support detection exactly. A target’s recorded support can differ from its later averaged level because further lows may join its group; the entry-time target remains fixed.
The report also warns that choosing the most favorable target margin or minimum-distance filter on this same window fits the rules to these data. No out-of-sample result is provided. The observed negative sum and the remaining supports should therefore be read together with the execution assumptions, overlap and limited validation.
Sources and data fingerprint
Source: the supplied RavenInvestor report and original chart, generated October 27, 2026 at 18:43 UTC; frozen market-data cutoff October 26, 2026. Declared origin: Binance USD(S)-M BTCUSDT daily aggTrades archives. Binance archive.
Reported data fingerprint: a6b1f7e04d103526. This identifies the supplied data version; it is not an independent audit of trade execution. The source report is an internal research input, not a downloadable file.