What the current setup actually describes
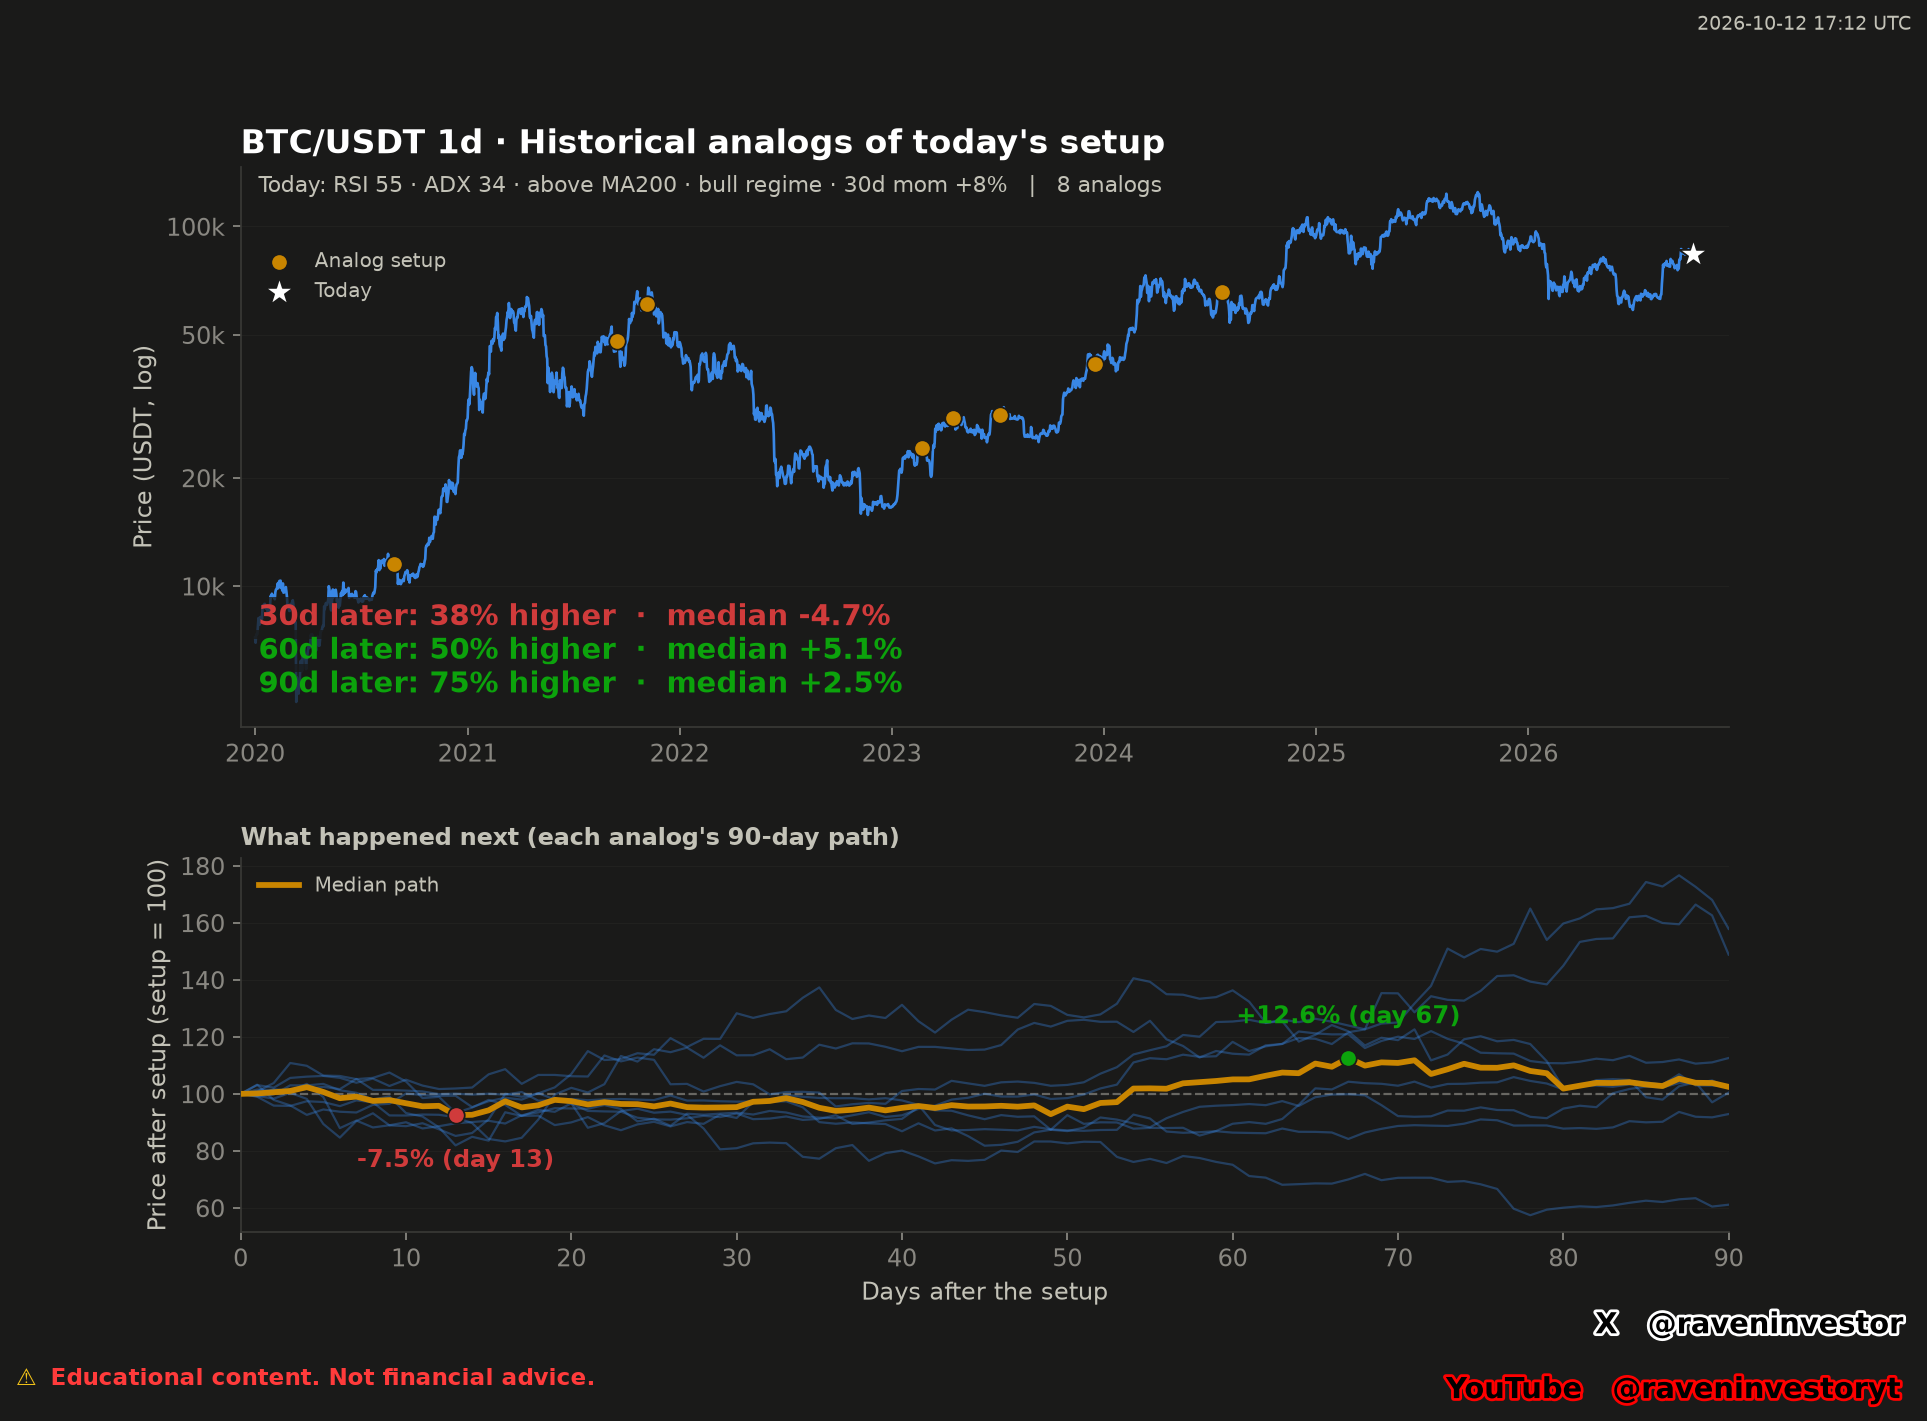
The October 11 snapshot places BTC/USDT above its daily MA200. It records RSI(14) at 54.6, ADX(14) at 34.1, 30-day momentum of +8.5% and a position-in-range reading of 0.71. The bull regime label comes from the MA50-versus-MA200 relationship. These observations define the setup being matched; the label does not establish a future price direction.
The search returns 20 matching days, grouped into eight distinct episodes. The relevant comparison sample is eight episodes, not 20 independent cases. Nearby matches are consolidated to avoid repeatedly counting the same episode, although grouping alone does not prove statistical independence between the remaining paths.
Within those eight episodes, the reported 30-day median is -4.7%, while the 90-day median is +2.5%. Three of eight were higher at 30 days, reported as 38%; six of eight were higher at 90 days, reported as 75%. These are historical frequencies under one matching rule, not estimated odds for the current setup.
Reading the price history and the normalized paths
The upper panel shows BTC/USDT daily price history on a logarithmic price axis. Orange markers locate the eight historical anchors; the white star identifies the current snapshot. The header uses whole-number labels—RSI 55, ADX 34 and momentum +8%—whereas the report supplies 54.6, 34.1 and +8.5%. The article retains the report’s precision.
In the lower panel, each of the eight episodes starts at 100. Thin blue lines show their separate 90-day paths and the orange line shows the median at each day. Above the dashed baseline means above that episode’s starting price; below it means below the starting price. These are normalized values, not prices in USDT.
The eight-episode median path is annotated at -7.5% on day 13 and +12.6% on day 67. Neither label describes the worst loss or best gain among individual cases. Nor does the day-67 label replace the +2.5% median at day 90. The orange line summarizes different observations at each step; it is not an executed trade or a promised route for Bitcoin.
For the same eight analogs, the image also reports 50% higher at 60 days and a +5.1% median. Individual 60-day results are absent from the TXT. We attribute that summary to the image and do not reconstruct the missing episode values.
Historical comparison: the eight supplied episodes
The table transcribes all eight anchors and their supplied 7-, 30- and 90-day price changes. Dates identify candle openings in UTC. These are subsequent price variations, not net strategy returns: the material does not specify an execution rule or trading costs.
| Anchor date (UTC) | After 7 days | After 30 days | After 90 days |
|---|---|---|---|
| 2020-08-28 | -9.4% | -6.6% | +48.8% |
| 2021-09-15 | -9.5% | +28.3% | +0.5% |
| 2021-11-05 | +5.2% | -19.1% | -38.9% |
| 2023-02-22 | -2.3% | +13.5% | +12.6% |
| 2023-04-17 | -6.5% | -6.9% | +2.7% |
| 2023-07-06 | +5.2% | -2.7% | -7.1% |
| 2023-12-17 | +3.9% | +4.2% | +57.9% |
| 2024-07-23 | +0.4% | -8.4% | +2.2% |
At seven days, four of eight episodes were higher (50%). The report gives a -1.0% median, a -1.6% mean and a range from -9.5% to +5.2%. An equal count of higher and lower outcomes did not imply equal move sizes.
At 30 days, the eight-episode sample has a -4.7% median but a +0.3% mean, with outcomes from -19.1% to +28.3%. The contrasting signs show why a single average is an incomplete description. The September 15, 2021 anchor has the largest listed gain at this horizon; November 5, 2021 has the largest listed loss.
At 90 days, the same eight episodes have a +2.5% median and a +9.8% mean, spanning -38.9% to +57.9%. The November 5, 2021 case remains negative, while the December 17, 2023 case supplies the largest listed gain. The August 28, 2020 case is negative at seven and 30 days, but positive at 90 days. A positive final summary does not erase earlier adverse paths.
Our interpretation is that horizon and dispersion matter more here than presenting 75% as a success rate. Eight selected episodes show mixed paths, including a substantial negative 90-day outcome. Historical similarity does not guarantee the same future outcome.
Source, matching rules and reproducibility
The declared source is Binance USD(S)-M BTCUSDT perpetual-futures aggTrades. Our own system builds candles through aggTrades → 1 second → 1 minute → 4 hours / 1 day / 1 week. The report states 3,386,930,944 processed aggTrades and 2,476 complete daily candles from January 1, 2020 through October 11, 2026. This describes the data coverage, not the size of the eight-episode comparison sample.
The matching fingerprint combines RSI(14), ADX(14), the side of MA200, the MA50-versus-MA200 regime, 30-day momentum and position within a range. The side of MA200 and the regime must match exactly. Other inputs use indicator-specific tolerances. Recent days are excluded, and nearby matches are grouped into episodes before their forward outcomes are summarized.
Numerical tolerances, the exclusion interval, grouping gap, range lookback and exact anchor-selection rule are not supplied. Neither is the complete indicator implementation. The declared archive clarifies provenance, but the supplied summary alone does not make the exact search independently reproducible.
The cutoff is frozen at October 11, 2026. The report and image were generated October 12, 2026 at 17:12 UTC. “Today” in the chart refers to that snapshot, not live market data. No new financial calculations were performed for this article.
What the study does not establish
With eight selected episodes, this is a small historical case study, not a validated predictive probability. Changing features or tolerances can change the analogs. History starts in 2020 and does not cover earlier Bitcoin cycles. Similarity does not show that the matching indicators caused later price moves.
No exact current price, numerical MA200, support or resistance is supplied. We therefore do not extract trading levels from the chart axis. The supported conclusion is narrower: under the declared selection method, eight past episodes shared the chosen characteristics, but their later outcomes differed by case and horizon.
Sources and data fingerprint
Sources: the supplied RavenInvestor report and image, generated October 12, 2026 at 17:12 UTC; underlying source declared as Binance USD(S)-M BTCUSDT daily aggTrades. This article does not independently reprocess the archive. View the Binance archive.
Data fingerprint declared by the report: d8810ad93768f617. It identifies the supplied data version; it does not certify predictive accuracy or replace independent verification.