Observed position: below the middle, not below the band
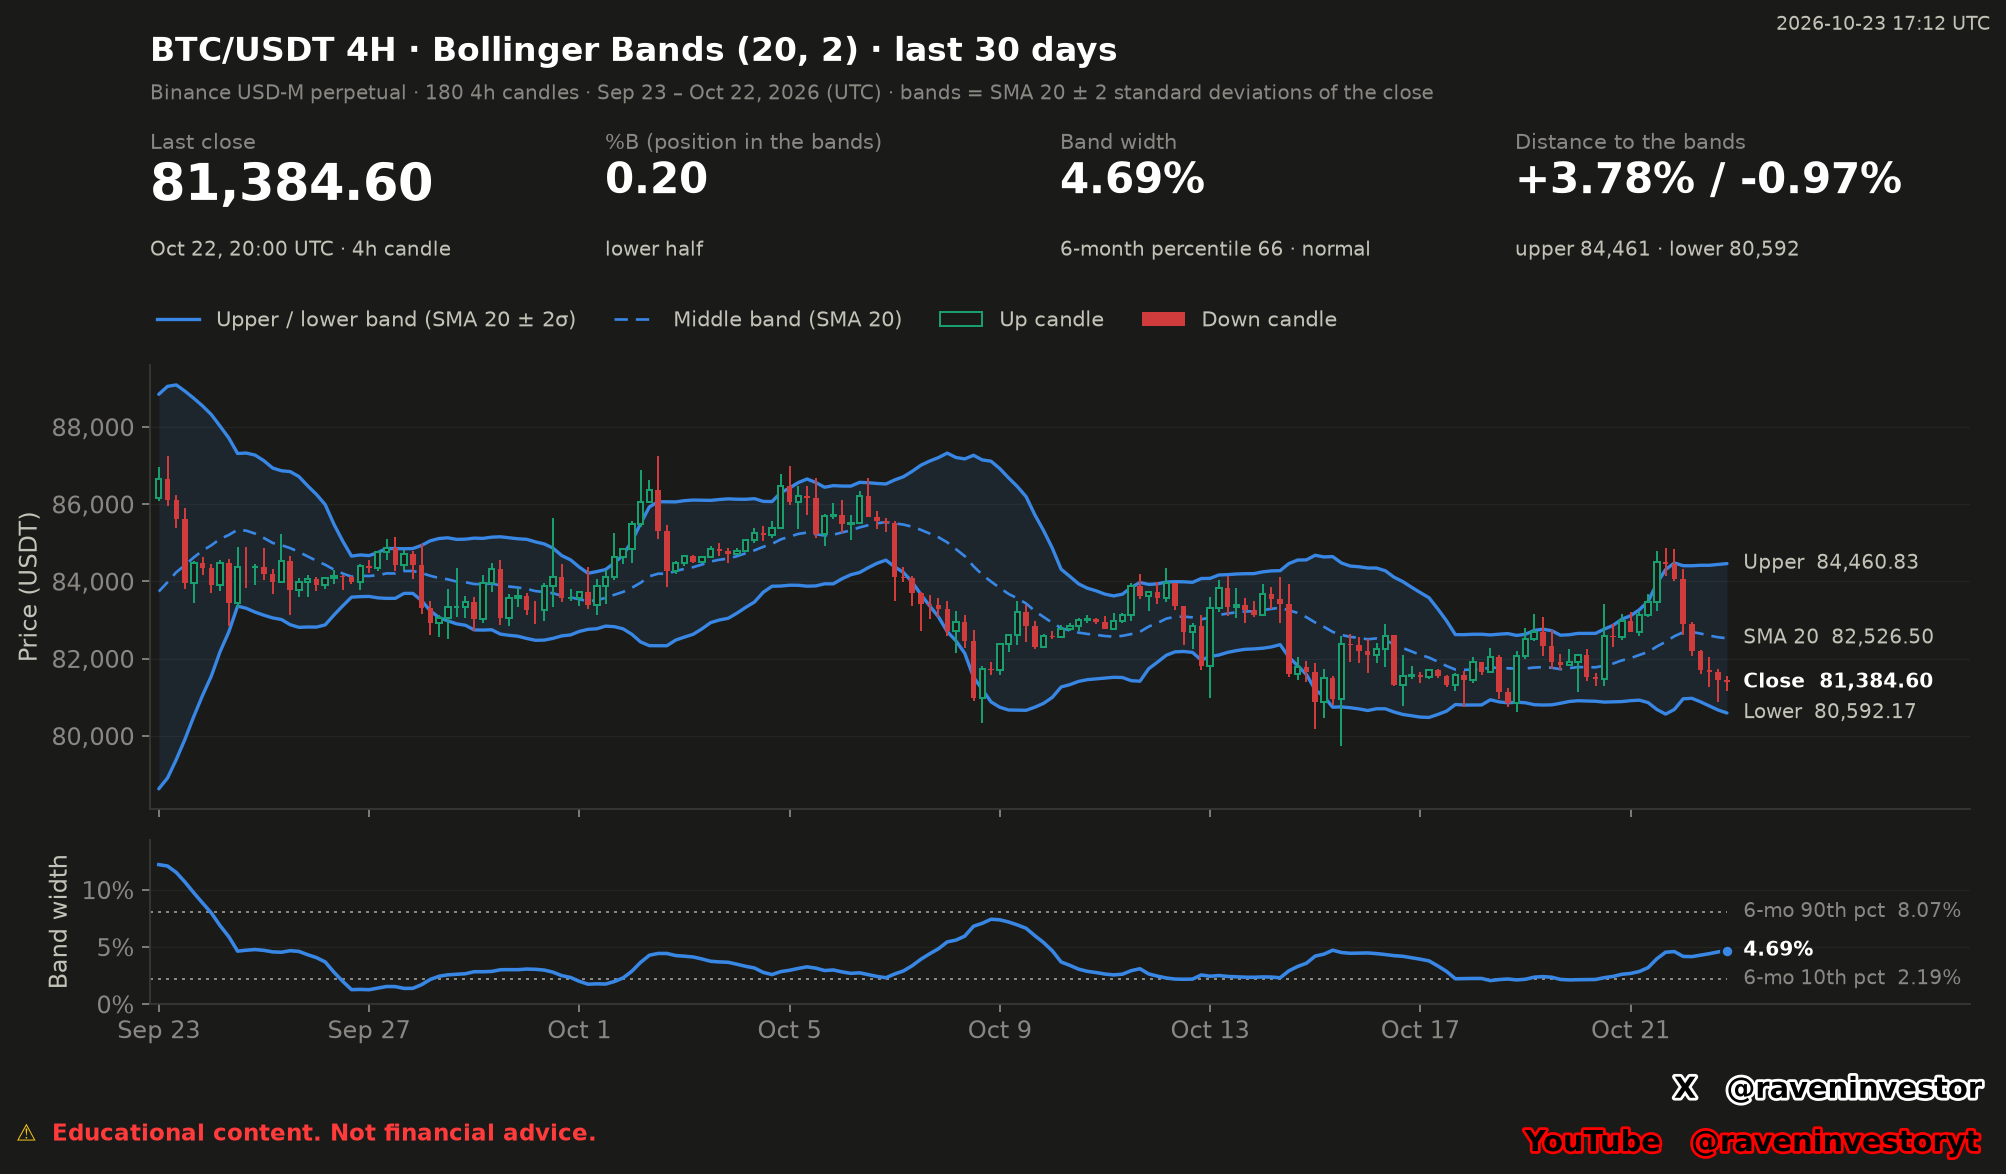
The final candle, identified by its October 22, 2026 opening at 20:00 UTC, closes at 81,384.60 USDT. Its SMA20 is 82,526.50 USDT and its lower band is 80,592.17 USDT. The reported %B of 0.20 places the close inside the bands and in their lower half. This is not an outside-band close.
The last 12 candles supplied in the report show a transition: the October 21 candles opening at 12:00 and 16:00 close above their respective upper bands, with %B readings of 1.17 and 1.04. By the October 22 candle opening at 04:00, the close is below the middle, followed by the remaining below-middle closes in the table.
Interpretation: the recent sequence moves from upper-band positioning to lower-half positioning. That description does not establish why prices changed, whether the lower band will hold, or whether another outside-band move will follow.
How to read the two panels
The upper panel overlays the price candles with solid blue upper and lower bands. The dashed blue line is the SMA20, and the shaded area is the interval between the bands. Green outlined candles mark rising candles; red filled candles mark falling candles. The right-hand labels identify the final band values and close, rather than fixed levels for the whole window.
The lower panel isolates band width. Its final 4.69% reading measures the separation between the upper and lower bands relative to the middle band. The dotted references shown in the image are 2.19% at the 10th percentile and 8.07% at the 90th percentile of the longer reference period. These are width thresholds, not price levels or probabilities of a future move.
The top distance card rounds the band prices to 84,461 and 80,592. The labels beside the candles and the article preserve the supplied two-decimal values. The %B value is a position ratio, not a return or a forecast probability.
Levels to Watch: references for this candle
The following distances are transcribed from the report and measured from the last close. A negative distance places a reference below that close; a positive distance places it above. The middle and bands recalculate with subsequent candles, so these values are snapshot references, not permanent support, resistance or trading targets.
| Reference | Price | Distance |
|---|---|---|
| Lower band | 80,592.17 USDT | −0.97% |
| Middle · SMA20 | 82,526.50 USDT | +1.40% |
| Upper band | 84,460.83 USDT | +3.78% |
What the 180-candle window adds
Within the visible sample of 180 four-hour candles, 11 closes were above the upper band and 13 below the lower band. The last such observations were October 21 at 16:00 and October 18 at 16:00 UTC, respectively. The report separately counts 32 upper-band wick touches and 27 lower-band wick touches. A wick touch and an outside close are different observations, not interchangeable signals.
The same 180-candle sample contains 29 crossings of the middle by the close, while the SMA20 fell 1.44% across the window. Width ranged from 1.26% on September 27 at 00:00 to 12.20% on September 23 at 00:00 UTC. Those observations show that the final position and width are only one point in a changing sequence.
For the separate 180-day width reference, the supplied minimum is 0.98%, the median 3.96% and the maximum 26.60%. The current 4.69% is assigned percentile 66 and labeled normal by the report. The exact number of eligible width observations in that reference is not supplied; it must not be confused with the 180 visible candles. This is descriptive context, not a backtest of what follows a band touch. Historical similarity does not guarantee the same future outcome.
The last 12 candles: a traceable recent sequence
This table reproduces the report’s 12-candle subset of the 180-candle window. Prices are in USDT; timestamps identify candle openings in UTC. Each close must be compared with the bands on its own row, rather than with the final bands applied backward.
| UTC opening | Close | Lower | SMA20 | Upper | %B | Width |
|---|---|---|---|---|---|---|
| 2026-10-21 00:00 | 82,699.00 | 80,911.17 | 82,010.51 | 83,109.85 | 0.81 | 2.68% |
| 2026-10-21 04:00 | 83,130.20 | 80,923.87 | 82,094.23 | 83,264.58 | 0.94 | 2.85% |
| 2026-10-21 08:00 | 83,463.40 | 80,861.96 | 82,171.43 | 83,480.90 | 0.99 | 3.19% |
| 2026-10-21 12:00 | 84,499.10 | 80,682.73 | 82,314.13 | 83,945.53 | 1.17 | 3.96% |
| 2026-10-21 16:00 | 84,448.60 | 80,563.97 | 82,434.63 | 84,305.29 | 1.04 | 4.54% |
| 2026-10-21 20:00 | 84,050.00 | 80,682.93 | 82,580.26 | 84,477.59 | 0.89 | 4.60% |
| 2026-10-22 00:00 | 82,887.40 | 80,958.70 | 82,682.58 | 84,406.47 | 0.56 | 4.17% |
| 2026-10-22 04:00 | 82,193.00 | 80,971.80 | 82,688.33 | 84,404.87 | 0.36 | 4.15% |
| 2026-10-22 08:00 | 81,699.80 | 80,879.67 | 82,648.38 | 84,417.10 | 0.23 | 4.28% |
| 2026-10-22 12:00 | 81,648.90 | 80,774.88 | 82,596.08 | 84,417.29 | 0.24 | 4.41% |
| 2026-10-22 16:00 | 81,459.10 | 80,668.21 | 82,553.06 | 84,437.90 | 0.21 | 4.57% |
| 2026-10-22 20:00 | 81,384.60 | 80,592.17 | 82,526.50 | 84,460.83 | 0.20 | 4.69% |
Methodology and limits
The source is the Binance USD(S)-M BTCUSDT perpetual future. RavenInvestor’s own system builds candles from public aggregate-trade records through one-second and one-minute series into higher timeframes. The report declares 3,386,930,944 aggTrades processed across 2,487 complete market days. That coverage describes the source dataset, not the sample size of the displayed chart.
Bollinger (20, 2) uses the simple average of 20 closes plus or minus two population standard deviations of those closes. The visible 30-day window reads 19 earlier candles so that its starting bands are complete. Width divides band separation by the SMA20; it does not divide by the last close. The report was generated October 23, 2026 at 17:12 UTC from a frozen October 22 cutoff.
Bands describe price dispersion and relative position, not future direction. Touching or crossing a band is not a standalone reversal signal. No strategy returns or forward-outcome sample are supplied, so this analysis assigns neither a success rate nor a trading recommendation to these observations.
Sources and data fingerprint
Source: the supplied RavenInvestor report and original chart, using Binance public BTCUSDT aggregate-trade archives. The report is an editorial input, not a public download. Binance archive.
Supplied data fingerprint: a2a3eef9343b6e73. This identifies the report’s data snapshot; it is not evidence of predictive accuracy or an independent replication.