August’s increase does not contradict a softer recent average
Mexico’s national headline INPC increased 0.20% in August 2026 after July’s 0.03%, according to the supplied report. The 12-month rate also rose between these two observations, from 3.12% to 3.26%. This is an increase in the latest rates, not evidence of what the next release will show.
The recent average tells a different story because it covers a different window. The report gives an average monthly change of −0.01% in June–August 2026, compared with 0.28% in March–May: three observations per group. June’s negative monthly reading remains in that recent average even though July and August are positive. An average is not accumulated three-month inflation.
For January–August, the reported total is 1.69% in 2026 versus 2.12% in 2025, comparing eight months in each year. Interpretation: the latest monthly increase and the lower year-to-date accumulation can coexist. Neither the three-month average nor the partial-year comparison means that August’s aggregate price level declined.
How to read the two panels and four summary figures
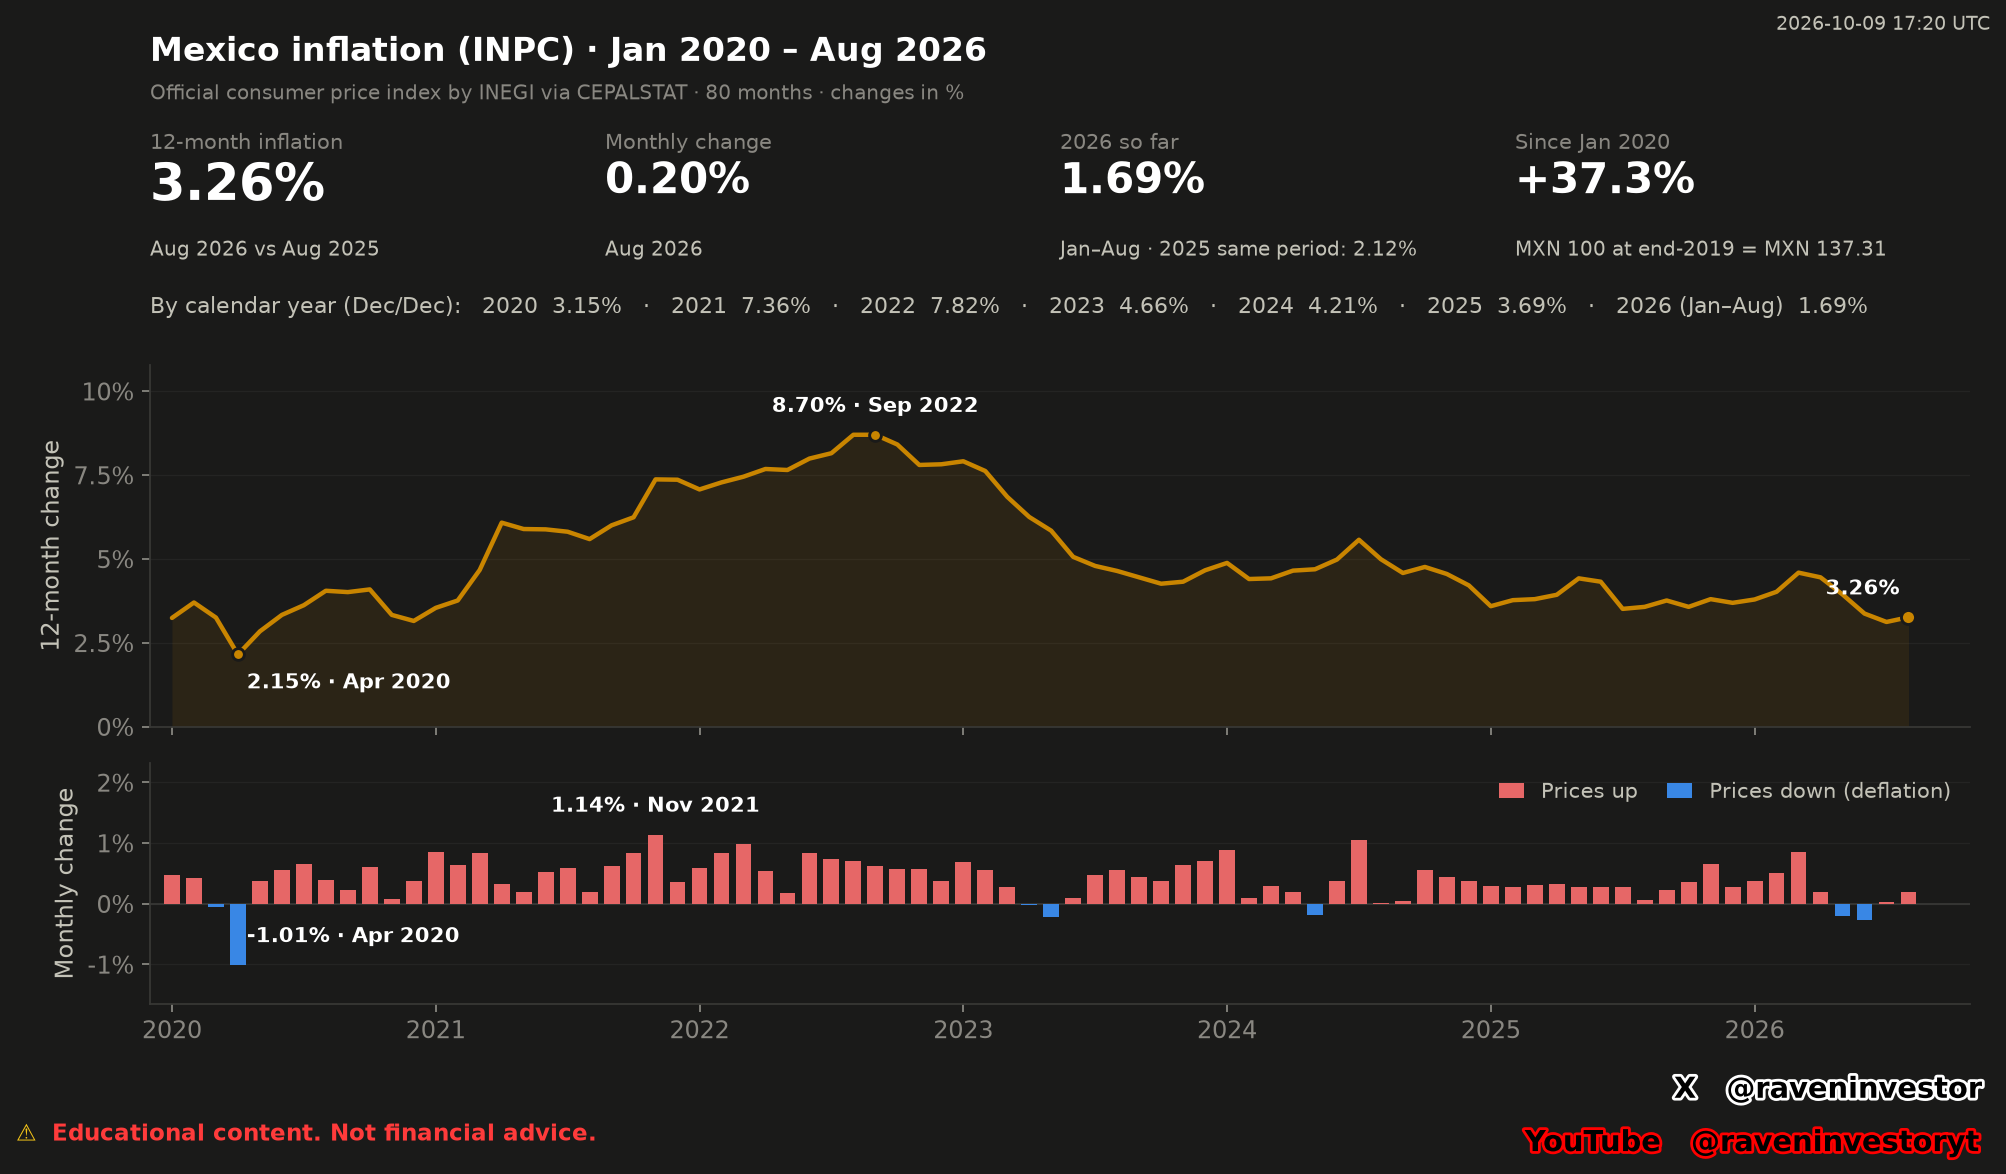
The summary cards separate August’s 12-month change, its monthly change, the January–August total and the full-window accumulation. The chart rounds the last figure to +37.3%; the report provides 37.31%. Both refer to the same cumulative measure, not to an annual rate.
Across the 80-month sample, the gold line marks a 12-month maximum of 8.70% in September 2022 and a minimum of 2.15% in April 2020. The table also displays 8.70% in August 2022: at the precision supplied, August and September share that maximum. The September annotation should not be read as proof of a unique peak. The line ends at 3.26% in August 2026.
The lower panel shows monthly changes for the same 80 months. Red bars represent increases; blue bars represent decreases. The report identifies seven months of deflation, with the largest monthly decline at −1.01% in April 2020. The highest monthly increase is 1.14% in November 2021. These monthly extremes are not the same measure as the gold line’s 12-month extremes.
The panels use different vertical scales and comparison periods. A falling gold line means a lower rate against a year earlier, not necessarily a falling price level. A blue monthly bar describes a decline in that month; it does not establish that the earlier cumulative increase has been reversed.
The eight monthly observations available for 2026
This extract contains eight observations from the full 80-month series. It places each monthly change beside its 12-month rate, so the two horizons can be checked without treating them as interchangeable. September–December 2026 are not present in this snapshot; they are not zero values.
| Month | Monthly change | 12-month change |
|---|---|---|
| 2026-01 | 0.38% | 3.79% |
| 2026-02 | 0.50% | 4.02% |
| 2026-03 | 0.86% | 4.59% |
| 2026-04 | 0.20% | 4.45% |
| 2026-05 | -0.21% | 3.94% |
| 2026-06 | -0.27% | 3.37% |
| 2026-07 | 0.03% | 3.12% |
| 2026-08 | 0.20% | 3.26% |
Comparing two August observations within the full sample, the 12-month rate is 3.26% in 2026 versus 3.57% in 2025. The report states a reduction of 0.31 percentage points. Thus, August’s rate is above July’s but below the rate a year earlier.
Historical comparison: six completed calendar years
The table compares six completed years, 2020–2025, within the 80-month study. Every entry measures December against the previous December. The highest annual reading is 2022’s 7.82%; the lowest is 2020’s 3.15%. The partial 2026 figure of 1.69% is excluded from this full-year ranking.
| Year | Reported annual inflation |
|---|---|
| 2020 | 3.15% |
| 2021 | 7.36% |
| 2022 | 7.82% |
| 2023 | 4.66% |
| 2024 | 4.21% |
| 2025 | 3.69% |
Interpretation: the completed-year rates describe a slower pace after the annual maximum, not a return to the earlier price level. These are descriptive comparisons of a limited historical sample. Historical similarity does not guarantee the same future outcome.
What MXN 100 becoming MXN 137.31 means
For the 80-month window, the report supplies cumulative inflation of 37.31% and its illustration: MXN 100 at end-2019 corresponds to MXN 137.31 in August 2026. The starting point is end-2019, which includes January 2020’s change. It is not a comparison starting at the end of January 2020.
This aggregate price comparison puts the latest rates in context: a lower rate of inflation does not erase increases already accumulated. It is not an investment return or a measurement of any individual household’s spending. The cumulative inflation percentage is also not itself a reported percentage loss of purchasing power; that separate calculation is not supplied here.
Methodology, provenance and limits
The report and chart were generated October 9, 2026 at 17:20 UTC. The declared source is INEGI’s national headline INPC via CEPALSTAT indicator 365, with an index base of the second half of July 2018 = 100. The article’s sample is Mexico’s 80 months, January 2020–August 2026.
Monthly inflation compares the index with the preceding month; 12-month inflation compares it with the same month a year earlier. Completed-year inflation compares December with the previous December. The current-year result compares the latest month with the preceding December, while the full-window accumulation uses the index ratio since end-2019. The article reproduces the supplied results without new financial calculations.
According to the report, our own system retains raw source responses with SHA-256 fingerprints. The broader database holds 720 monthly records across nine countries and records no agency corrections at this snapshot. That broader count is not the sample size of this Mexico analysis, and it does not rule out future revisions.
Rates derived from CEPALSTAT’s index, published to two decimals, may differ by a few hundredths from INEGI’s rounded rates. The series measures prices in Mexican pesos, not dollars, and does not cover years before 2020. No spending-category contributions or causal findings were supplied, so no explanation of the drivers is inferred. The underlying agency responses were not independently reprocessed for this article.
Sources and data fingerprint
Sources: supplied RavenInvestor report and original chart, October 9, 2026, 17:20 UTC. Declared underlying series: Mexico national headline INPC, INEGI via CEPALSTAT indicator 365. Latest reference month: August 2026. Declared data channel: CEPALSTAT.
Data fingerprint declared by the report: 40a4c3fcaea93ad7. Identifies the supplied version; it is not an independent audit of the underlying source data.