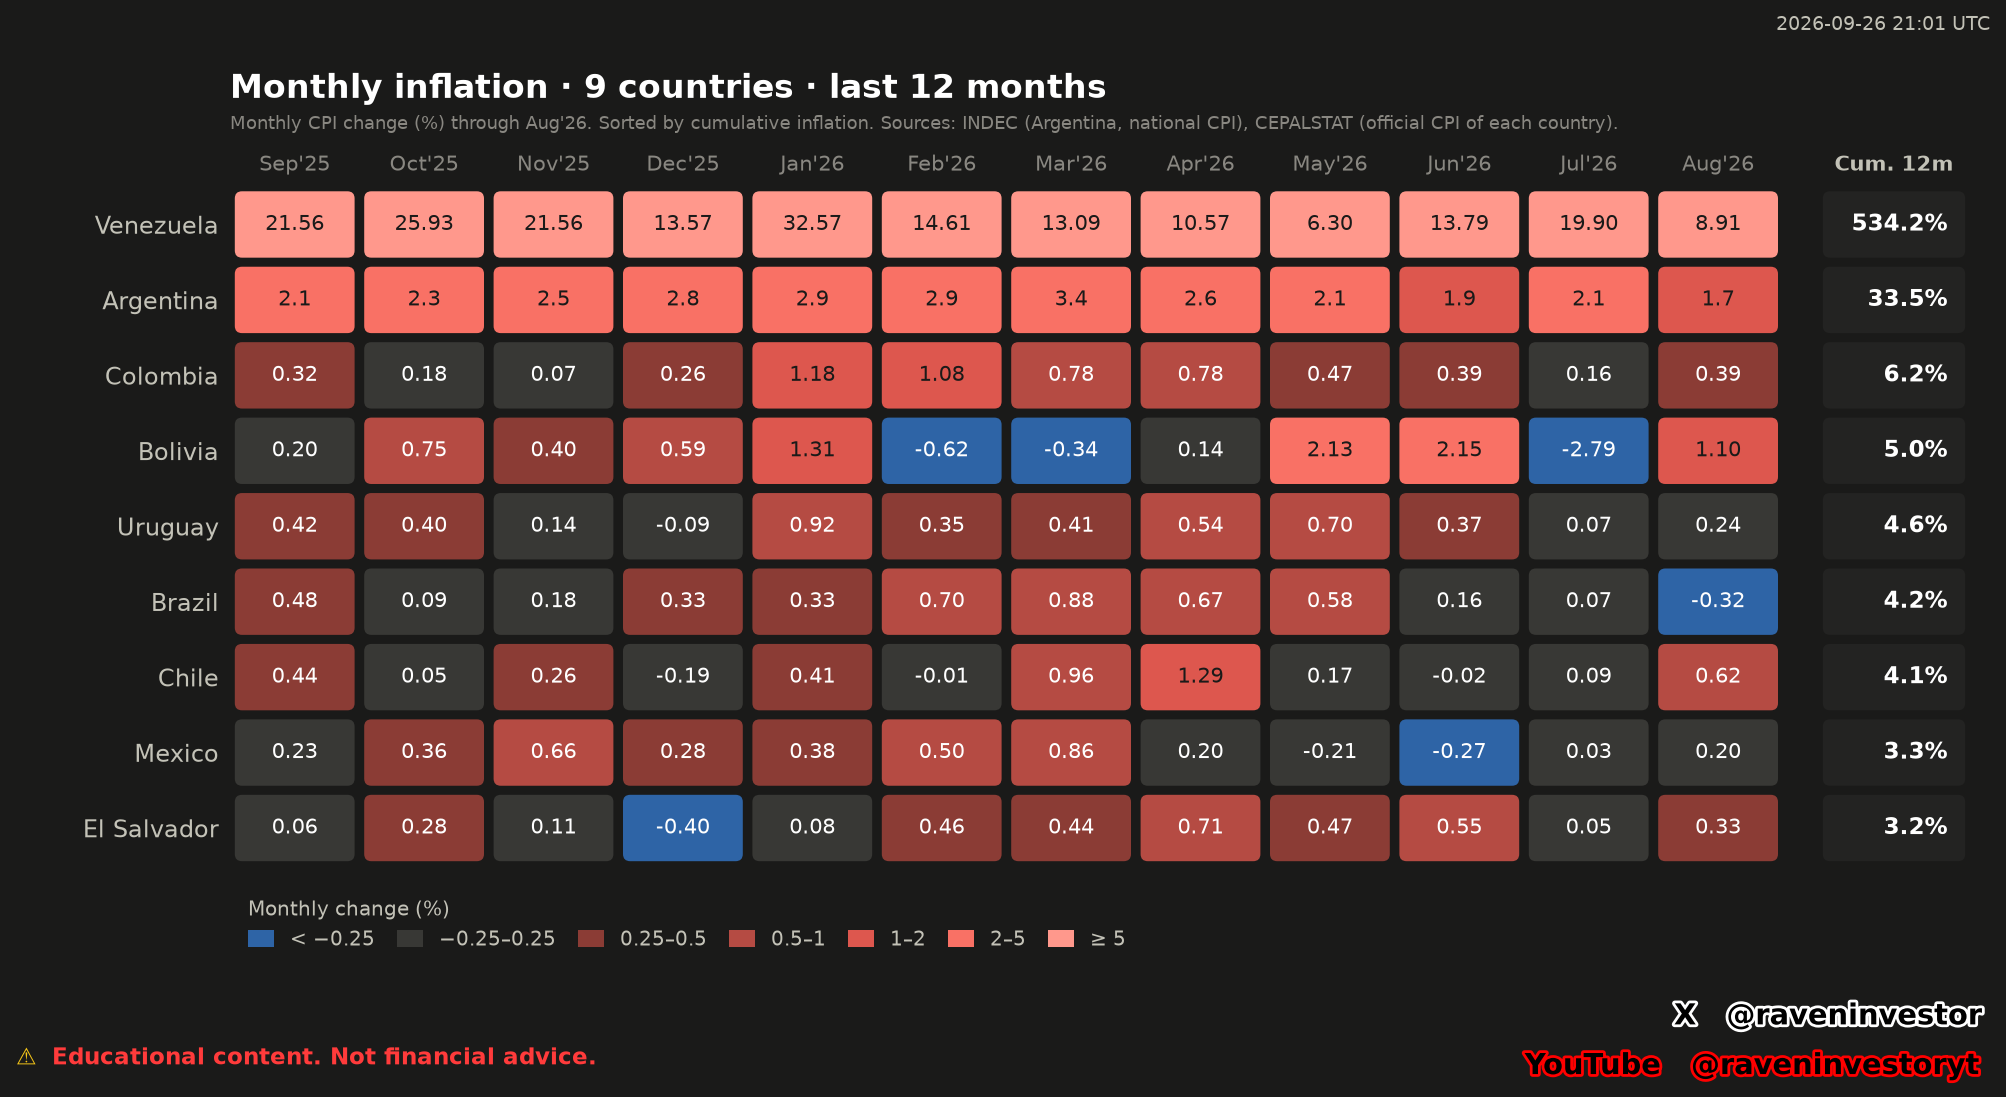
How to read the heatmap
The rows rank the nine countries by cumulative inflation from September 2025 through August 2026. The monthly cells answer a different question: how the consumer price index changed relative to the preceding month. The final column summarizes the full window; it is not another monthly observation.
The color scale uses seven classes: below -0.25%; -0.25% to 0.25%; 0.25%–0.5%; 0.5%–1%; 1%–2%; 2%–5%; and at least 5%. Blue marks the lowest class, gray the band around zero, and warmer colors progressively larger positive changes. Gray therefore includes small increases and small decreases, not just unchanged prices.
Venezuela occupies the highest color class in all 12 months. Its January reading of 32.57% and May reading of 6.30% share a color despite differing substantially. Read the printed figures: a saturated row does not mean a constant monthly rate. The cumulative labels in the image use one decimal; the table below retains the report’s precision.
The 12-month ranking is not the August ranking
In this sample of nine countries and 108 country-month observations, Venezuela records the highest cumulative inflation, followed by Argentina. Colombia, Bolivia, Uruguay, Brazil, Chile, Mexico and El Salvador remain below 10% over the same window. This describes the selected countries, not a ranking of every economy.
El Salvador has the lowest cumulative figure, but not the lowest August reading. Brazil’s August change is negative even though its cumulative inflation remains positive. The distinction matters: an individual month describes a movement within the path, whereas the accumulated result describes the window as a whole.
| Country | August 2026 | 12-month cumulative | Agency |
|---|---|---|---|
| Venezuela | 8.91% | 534.21% | BCV |
| Argentina | 1.7% | 33.5% | INDEC |
| Colombia | 0.39% | 6.25% | DANE |
| Bolivia | 1.10% | 5.02% | INE — Bolivia |
| Uruguay | 0.24% | 4.55% | INE — Uruguay |
| Brazil | -0.32% | 4.22% | IBGE |
| Chile | 0.62% | 4.13% | INE — Chile |
| Mexico | 0.20% | 3.26% | INEGI |
| El Salvador | 0.33% | 3.20% | BCR |
Historical comparison: three months against the preceding three
The report compares June–August 2026 with March–May 2026: three monthly observations per period, for each of the nine countries. The values below are supplied averages of monthly changes, not cumulative inflation over either three-month period. The report classifies movements of less than 0.10 percentage points between these averages as stable.
Venezuela illustrates why the choice of horizon matters. Its monthly inflation falls from 19.90% in July to 8.91% in August, yet its recent three-month average is higher than the preceding one. A lower latest observation can coexist with acceleration under the report’s three-month comparison.
Argentina shows a lower recent average while remaining second in the cumulative ranking. Brazil and Mexico have slightly negative recent averages, but their 12-month cumulative figures remain positive. These are compatible observations, not contradictory signals: the measures cover different spans.
Interpretation: the table is useful for separating the inflation already accumulated from its recent pace. It does not establish why either changed, whether the change will persist, or how an asset price will respond. Historical similarity does not guarantee the same future outcome.
| Country | March–May 2026 | June–August 2026 | Reported pace |
|---|---|---|---|
| Venezuela | 9.99% | 14.20% | Acceleration |
| Argentina | 2.70% | 1.90% | Deceleration |
| Colombia | 0.68% | 0.31% | Deceleration |
| Bolivia | 0.64% | 0.15% | Deceleration |
| Uruguay | 0.55% | 0.23% | Deceleration |
| Brazil | 0.71% | -0.03% | Deceleration |
| Chile | 0.81% | 0.23% | Deceleration |
| Mexico | 0.28% | -0.01% | Deceleration |
| El Salvador | 0.54% | 0.31% | Deceleration |
Negative cells do not erase accumulated inflation
The report identifies 11 negative country-month observations within the 108-cell sample. That count is not 11 separate calendar months: different countries can record negative changes in the same month.
The largest reported monthly declines are Bolivia in July 2026 (-2.79%) and February 2026 (-0.62%), El Salvador in December 2025 (-0.40%), Bolivia in March 2026 (-0.34%), and Brazil in August 2026 (-0.32%). They document falls in the respective aggregate CPI for those months, not a fall in every individual price.
All nine cumulative figures remain positive. The evidence therefore supports occasional monthly declines alongside a higher index over the complete window; it does not support calling the entire sample a period of falling prices.
Methodology, sources and limits
The supplied report and chart are dated September 26, 2026, 21:01 UTC; the latest reference month is August 2026. Publication time and the period measured are different. The system’s declared database contains 720 monthly records from January 2020 through August 2026, but this article analyzes only the 108 observations in the selected 12-month window.
RavenInvestor’s own system assembles headline CPI series with one record per country and month. According to the report, CEPALSTAT indicator 365 provides official country indices; Argentina instead uses INDEC’s national CPI via ArgentinaDatos because the Argentina series in that CEPAL source covers Greater Buenos Aires.
Monthly changes for the CEPAL series are derived from the index; Argentina uses its published change at one decimal. Cumulative inflation uses index ratios, with Argentina’s official year-on-year rate for the 12-month comparison; the report also describes chaining monthly changes when applicable. Monthly percentages must not be added to reproduce the cumulative figure. No new financial calculations were performed for this article.
Comparability has limits. The report identifies Bolivia’s coverage as nine capital cities and El Salvador’s as six departments, with the remaining series national. Variations derived from indices may differ by approximately 0.1 percentage points from rounded agency releases. These are local-currency price changes, not changes in prices measured in US dollars.
The system reports no recorded corrections, but agencies can revise historical figures and publish on different schedules. That record is not proof that the series will never be revised. The supplied snapshot has an August value for every country; later releases may have missing cells.
What this comparison establishes
The strongest finding is the separation between accumulated inflation, the latest monthly change and the recent average. Venezuela’s cumulative position, Brazil’s negative August reading and El Salvador’s lowest cumulative result describe different dimensions of the same nine-country sample.
Use the ranking to locate the cumulative result and the monthly sequence to understand its path. Neither replaces the other, and neither supplies a forecast or an explanation of the economic causes.
Sources and data fingerprint
Declared origin of the series: CEPALSTAT, indicator 365. For Argentina: INDEC national CPI, via ArgentinaDatos. These links identify the sources; their current data may incorporate releases after this snapshot.
Data fingerprint declared by the report: 3bb18547ea301496. Our own system retains source responses with SHA-256 hashes. The fingerprint above identifies this report version; it does not substitute for an independent data audit.