A negative month does not erase the cumulative increase
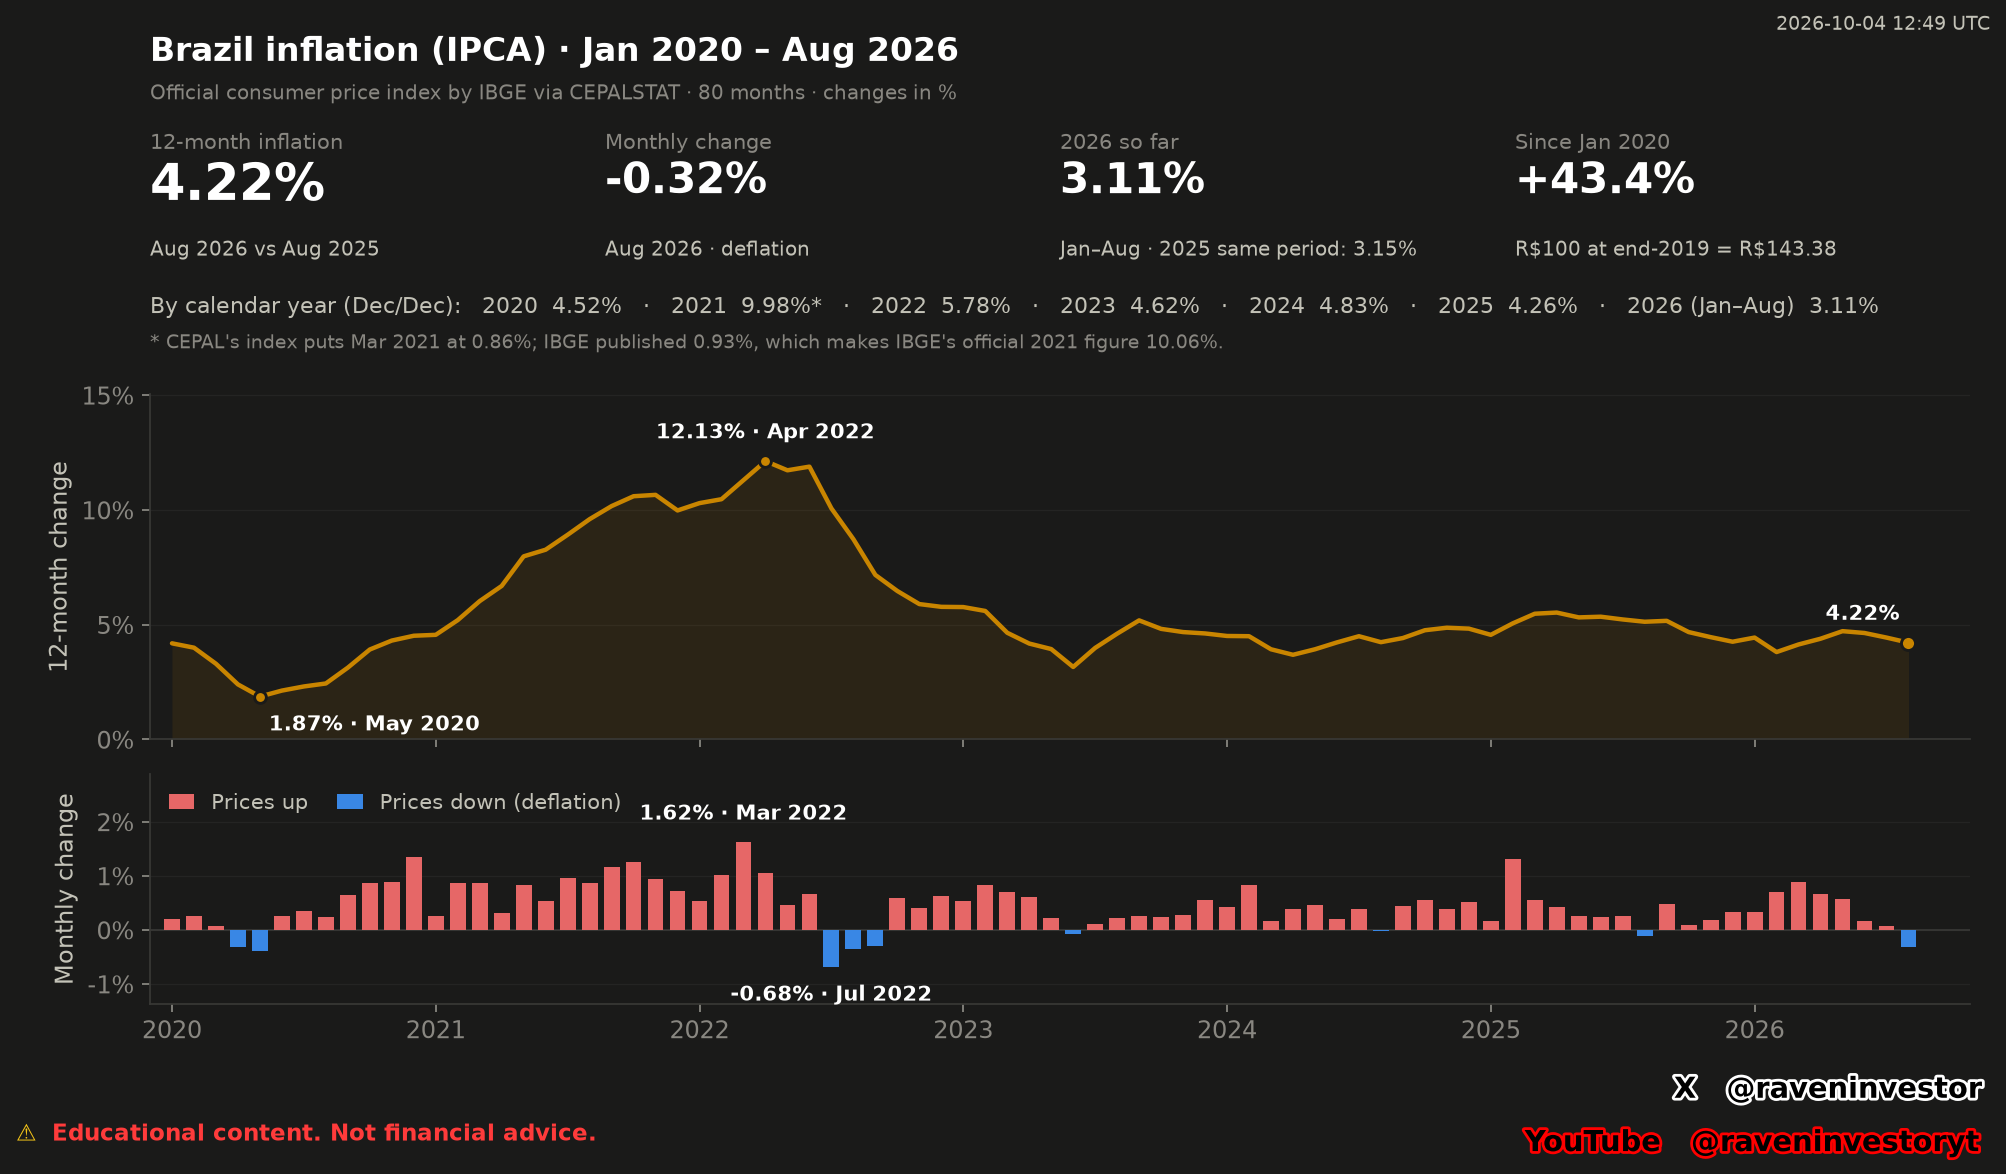
Brazil’s national IPCA fell 0.32% in August 2026 against the preceding month, according to the RavenInvestor report. Against August 2025, the index was still 4.22% higher. These readings are compatible: the monthly measure describes the latest step, while the 12-month measure compares a different pair of index levels.
Across the 80-month January 2020–August 2026 sample, the report gives a cumulative increase of 43.38%, measured from the end of 2019. Its supplied illustration is R$100 at end-2019 corresponding to R$143.38 in August 2026 under this index. That is an index-based price comparison, not an investment return or a calculation of any particular household’s expenses.
Interpretation: the latest month records falling aggregate prices, but it does not restore the earlier price level. The positive cumulative total and the negative monthly reading describe different horizons. Neither establishes the direction of the next observation.
How to read the chart without mixing horizons
The summary cards distinguish 12-month inflation, the latest monthly change, the current calendar year and the full window. The chart rounds the cumulative increase to +43.4%; the report supplies 43.38%. The R$143.38 illustration uses the end of 2019 as its base, so January 2020’s change is included.
The gold line in the upper panel traces the 12-month rate across the 80 monthly observations. Its labels identify a low of 1.87% in May 2020 and a high of 12.13% in April 2022, before the final 4.22% reading. This line is not the price level and does not show the inflation accumulated since 2020.
The lower panel shows the monthly changes for the same 80-month sample. Red bars are positive and blue bars are negative. March 2022 has the largest reported monthly increase, 1.62%; July 2022 has the largest decline, -0.68%. The report identifies deflation in 9 of the 80 months. These labels describe the aggregate index, not every individual consumer price.
The upper and lower panels use different percentage scales and comparison periods. A bar below zero can coexist with a positive 12-month line, as in August 2026. The line’s highest point and the largest monthly bar also occur in different months.
Historical comparison: the recent pace and calendar years
Within the 80-month sample, the report compares the 12-month rate in August 2026, 4.22%, with August 2025, 5.13%. It states a decline of 0.91 percentage points. This is a comparison of two annual-rate observations, not a fall of 0.91% in the price index.
The January–August comparison uses eight months in each year: cumulative inflation is 3.11% in 2026 and 3.15% in 2025. The recent-pace comparison uses three monthly observations per group: June–August 2026 averages -0.03%, versus 0.71% for March–May. These are the report’s supplied averages, not cumulative three-month changes.
The table below contains the six completed calendar-year results, 2020–2025, within the 80-month study. Each compares December with the previous December. The 2026 figure of 3.11% covers only January–August and is deliberately kept outside that full-year ranking.
| Year | Reported annual inflation |
|---|---|
| 2020 | 4.52% |
| 2021* | 9.98% |
| 2022 | 5.78% |
| 2023 | 4.62% |
| 2024 | 4.83% |
| 2025 | 4.26% |
* For 2021, the report gives 9.98% from CEPALSTAT and separately cites IBGE’s published 10.06%; the source issue is explained in the next section. Among these six completed years, 2021 is highest and 2025, at 4.26%, is lowest in the reported series.
Interpretation: the recent monthly average is lower, while accumulated inflation remains positive. This separates recent pace from the price increase already recorded. The descriptive comparisons do not establish why the changes occurred. Historical similarity does not guarantee the same future outcome.
The 2021 source issue must remain visible
The report flags March 2021 at 0.86% in the CEPALSTAT-derived series, against 0.93% published by IBGE. It associates that discrepancy with a 2021 result of 9.98% rather than IBGE’s official 10.06%, and says the 12-month readings from March 2021 through February 2022 are approximately 0.07 percentage points below the official figures.
Those are two attributed source versions, not interchangeable estimates of one published value. This article preserves the chart and report’s series and labels the discrepancy; it does not insert the IBGE figure into selected cells or recalculate the cumulative result. Consequently, 43.38% should be read as the cumulative result of the reported series, not as an independently verified, corrected official total.
Methodology and limits
The report and image were generated October 4, 2026 at 12:49 UTC. Their latest reference month is August 2026; the generation date is not an October inflation reading. The declared source is IBGE’s national headline IPCA through CEPALSTAT indicator 365, with an index base of January 2012 = 100.
The report defines monthly change against the previous month, 12-month change against the same month a year earlier, and full calendar-year change as December against December. The current-year comparison starts at the preceding December; the full-window comparison starts at end-2019. No new financial calculations were performed for this article.
Our own system retains raw source responses with SHA-256 fingerprints, according to the report. Its broader database covers 720 monthly records across nine countries; this article uses only Brazil’s 80 months. Source indices are published to two decimal places, which can produce small rounding differences from IBGE’s published rates, separately from the explicitly flagged 2021 discrepancy.
The supplied report does not provide expenditure-category contributions or a causal analysis. It measures inflation in Brazilian reais, not dollar-denominated price changes, and does not cover years before 2020. Revisions may change earlier readings. The report and chart support this descriptive analysis, but the underlying raw source responses were not independently reprocessed here.
Sources and data fingerprint
Sources: RavenInvestor report and chart dated October 4, 2026, 12:49 UTC; declared underlying series: IBGE national IPCA via CEPALSTAT indicator 365. The IBGE comparison for 2021 is attributed to the supplied report. Underlying source: CEPALSTAT API.
Data fingerprint declared by the report: 39808e04d7a4927c. Identifies the supplied data version; it is not a certification that the source discrepancy has been corrected or an independent audit.