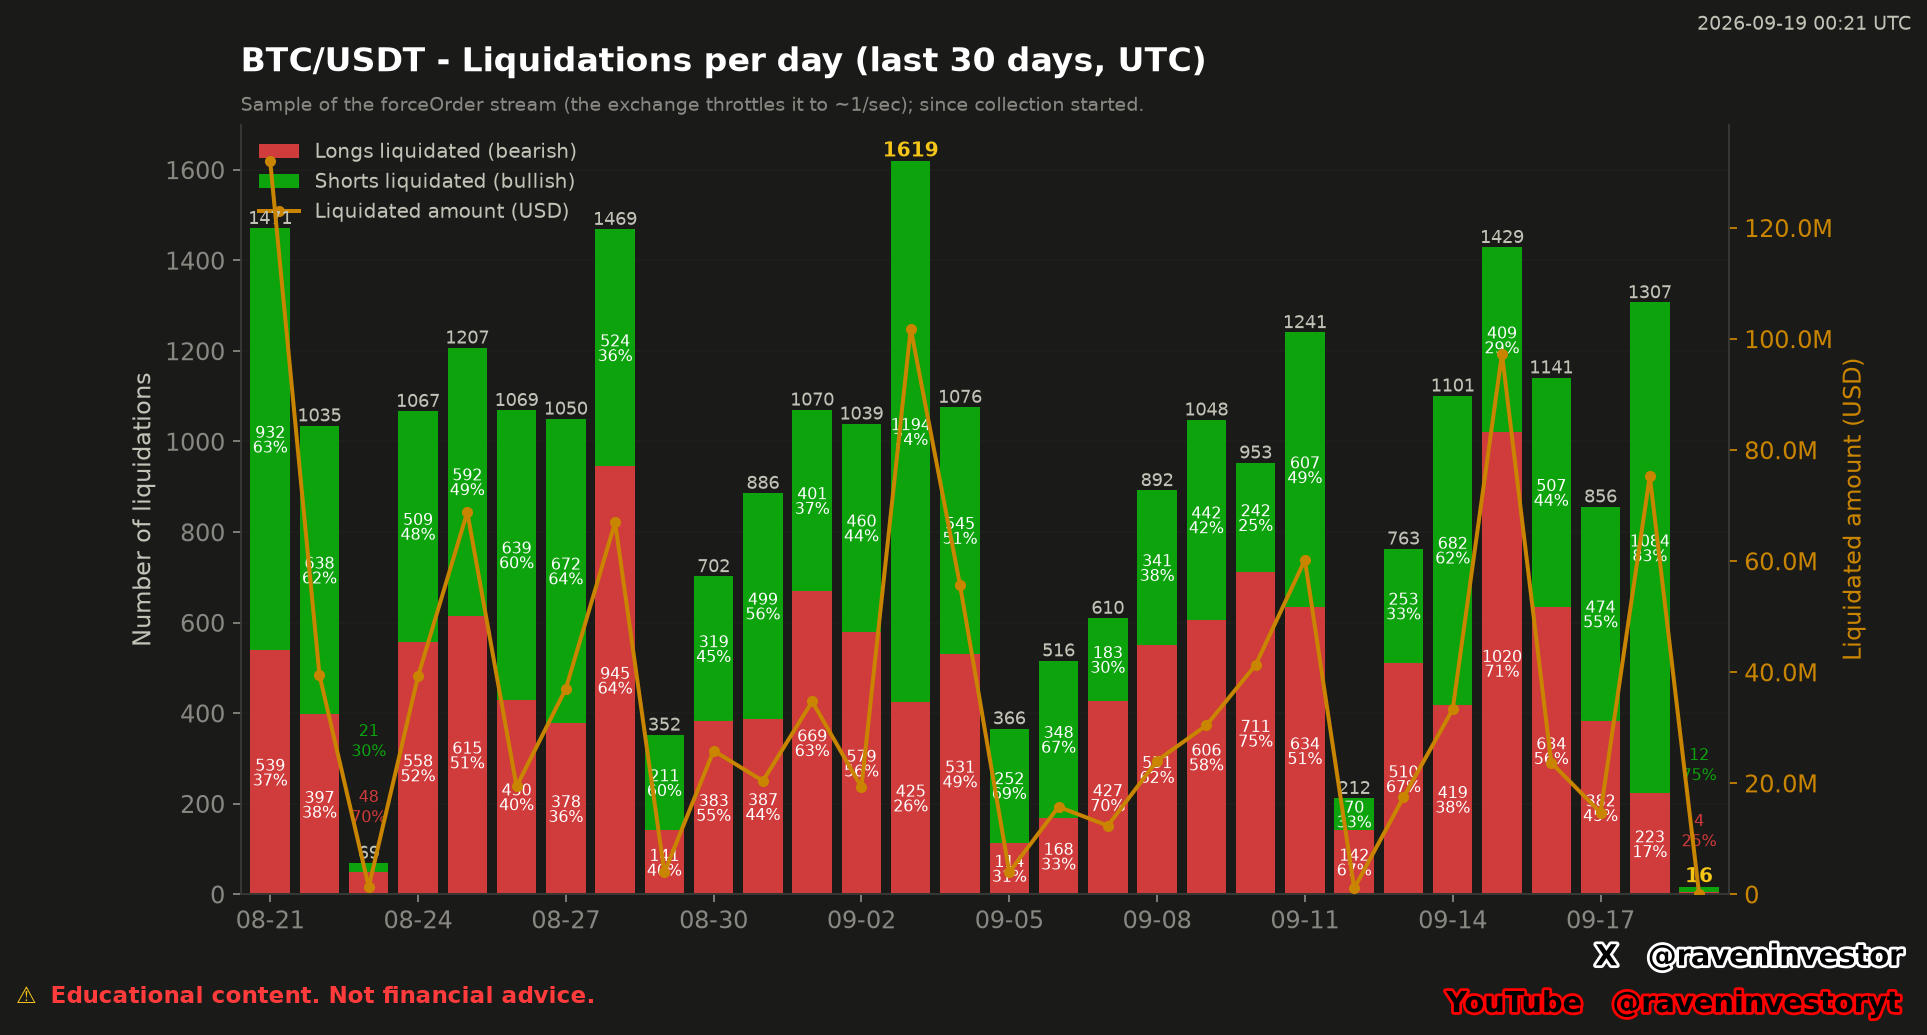
Two different measures of liquidation activity
Observed: RavenInvestor’s BTCUSDT public-stream sample contains 27,632 captured liquidation events and USD 1,116,686,419 in reported notional across August 21–September 19, 2026 UTC. Long liquidations account for 49.1% of the events and short liquidations for 50.9%. These percentages describe counts, not the distribution of dollar amounts.
The highest count and the highest reported amount occur on different dates within this 30-date sample. September 3 records 1,619 events and USD 101,853,020. August 21 records 1,471 events but the table’s highest notional, USD 131,981,957. A count-based ranking therefore does not describe the same activity as an amount-based ranking.
Interpretation: the useful result is not that one side will now drive Bitcoin’s price. It is that frequency, amount and the side being liquidated need to be read separately. The report does not provide a price-response study or a breakdown of aggregate notional by side.
How to read the bars and the yellow line
Each stacked bar corresponds to a UTC date. Red counts liquidations of long positions; green counts liquidations of short positions. Their combined height is the daily event count on the left axis. The labels inside the bars give each side’s count and rounded share for that date; the label above gives the total.
The yellow line uses the right axis and represents reported USD notional. Its height must not be read against the event-count axis. The chart’s “bearish” and “bullish” legend labels identify its directional convention; they do not establish what happened next or provide forecasts.
The chart is a record of captured events, not a liquidation heatmap of estimated future price zones. It supplies no Bitcoin support or resistance levels, so this analysis does not turn the bars into price targets.
Daily concentration behind a near-even overall split
Within the 30-date window, September 3 contains 1,194 short liquidations and 425 long liquidations. The chart labels their shares as 74% and 26%. September 15 presents the opposite balance: 1,020 long liquidations and 409 short liquidations, labelled 71% and 29%, with USD 97,312,762 in reported notional.
September 18 contains 1,084 short liquidations and 223 long liquidations, labelled 83% and 17%, with USD 75,346,825 in reported notional. These observations show that the window’s near-even event split conceals daily changes in which side predominated.
This is a comparison inside one captured sample of 27,632 events, not a test across independent historical episodes. It cannot establish a recurring liquidation pattern or its predictive value. Historical similarity does not guarantee the same future outcome.
Why 16 events do not establish a quietest completed day
September 19 contains 16 captured events: 4 long and 12 short liquidations, with USD 84,751 in reported notional. The report was generated at 00:21 UTC on that date. The observation is an unfinished day and must not be ranked alongside closed dates as evidence that liquidation activity collapsed.
The report’s daily averages are 921 events and USD 37,222,881. These supplied averages retain the partial final date; they are not averages restricted to completed days. No alternative average has been calculated here.
Low counts on other dates also require caution. The report warns that interruptions in the collector can reduce recorded activity. It provides no uptime log, so a low bar alone cannot distinguish quiet trading from incomplete collection, or prove that an interruption occurred.
Methodology, coverage and what can be verified
The declared source is Binance USDⓈ-M’s public BTCUSDT forceOrder stream. RavenInvestor describes its own data-collection system as operating continuously, with incremental imports and duplicate removal. Stored events are grouped by UTC date and liquidated side; daily amount is the sum of each event’s reported USD notional.
The collector’s broader history contains 28,341 captured events from August 20 through September 19, 2026. That coverage is not the article’s 27,632-event window beginning August 21. The two totals refer to different scopes, rather than conflicting counts.
The supplied report says the public stream is limited to approximately one event per second. This is an exchange-filtered sample, not a complete liquidation ledger or a demonstrated random sample. We cannot extrapolate its counts to all Binance activity or the wider market.
Notional is the reported size associated with liquidation events, not the trader’s actual loss. We retain the document’s USD denomination without inferring a USD/USDT conversion. The report does not specify the underlying notional fields, conversion method or collector uptime for each date.
Editorial checks found the daily long and short counts consistent with their totals, the daily totals consistent with the reported window, and the labelled chart observations consistent with the report. Those checks do not independently validate collection completeness or reproduce the event-level dataset, which was not supplied.
What this sample supports
The evidence supports a narrow conclusion: the largest captured event count and the largest reported notional occurred on different dates, and the predominant liquidated side varied within the window. It does not support a claim about total market losses, a permanently dominant side or Bitcoin’s next direction.
The daily table and documented methodology let readers trace these observations to the supplied aggregates. The unfinished final day and public-stream restrictions remain part of the result, not qualifications that can be removed from it.
Daily evidence and data fingerprint
Transcribed from the supplied supporting report, without estimating missing events. Dates are UTC. September 19 is partial.
| UTC date | Longs | Shorts | Total | Notional (USD) |
|---|---|---|---|---|
| 2026-08-21 | 539 | 932 | 1,471 | 131,981,957 |
| 2026-08-22 | 397 | 638 | 1,035 | 39,456,189 |
| 2026-08-23 | 48 | 21 | 69 | 1,321,023 |
| 2026-08-24 | 558 | 509 | 1,067 | 39,245,762 |
| 2026-08-25 | 615 | 592 | 1,207 | 68,801,981 |
| 2026-08-26 | 430 | 639 | 1,069 | 19,404,426 |
| 2026-08-27 | 378 | 672 | 1,050 | 36,996,321 |
| 2026-08-28 | 945 | 524 | 1,469 | 66,958,284 |
| 2026-08-29 | 141 | 211 | 352 | 3,921,770 |
| 2026-08-30 | 383 | 319 | 702 | 25,837,066 |
| 2026-08-31 | 387 | 499 | 886 | 20,394,895 |
| 2026-09-01 | 669 | 401 | 1,070 | 34,704,511 |
| 2026-09-02 | 579 | 460 | 1,039 | 19,259,679 |
| 2026-09-03 | 425 | 1,194 | 1,619 | 101,853,020 |
| 2026-09-04 | 531 | 545 | 1,076 | 55,687,424 |
| 2026-09-05 | 114 | 252 | 366 | 3,966,735 |
| 2026-09-06 | 168 | 348 | 516 | 15,738,979 |
| 2026-09-07 | 427 | 183 | 610 | 12,335,150 |
| 2026-09-08 | 551 | 341 | 892 | 24,039,563 |
| 2026-09-09 | 606 | 442 | 1,048 | 30,400,958 |
| 2026-09-10 | 711 | 242 | 953 | 41,281,050 |
| 2026-09-11 | 634 | 607 | 1,241 | 60,181,114 |
| 2026-09-12 | 142 | 70 | 212 | 1,058,568 |
| 2026-09-13 | 510 | 253 | 763 | 17,441,493 |
| 2026-09-14 | 419 | 682 | 1,101 | 33,291,038 |
| 2026-09-15 | 1,020 | 409 | 1,429 | 97,312,762 |
| 2026-09-16 | 634 | 507 | 1,141 | 23,674,576 |
| 2026-09-17 | 382 | 474 | 856 | 14,708,549 |
| 2026-09-18 | 223 | 1,084 | 1,307 | 75,346,825 |
| 2026-09-19 · partial | 4 | 12 | 16 | 84,751 |
Data fingerprint declared by the report: fceac66c9d4c2626. This fingerprint identifies the supplied version; it does not certify collection completeness.