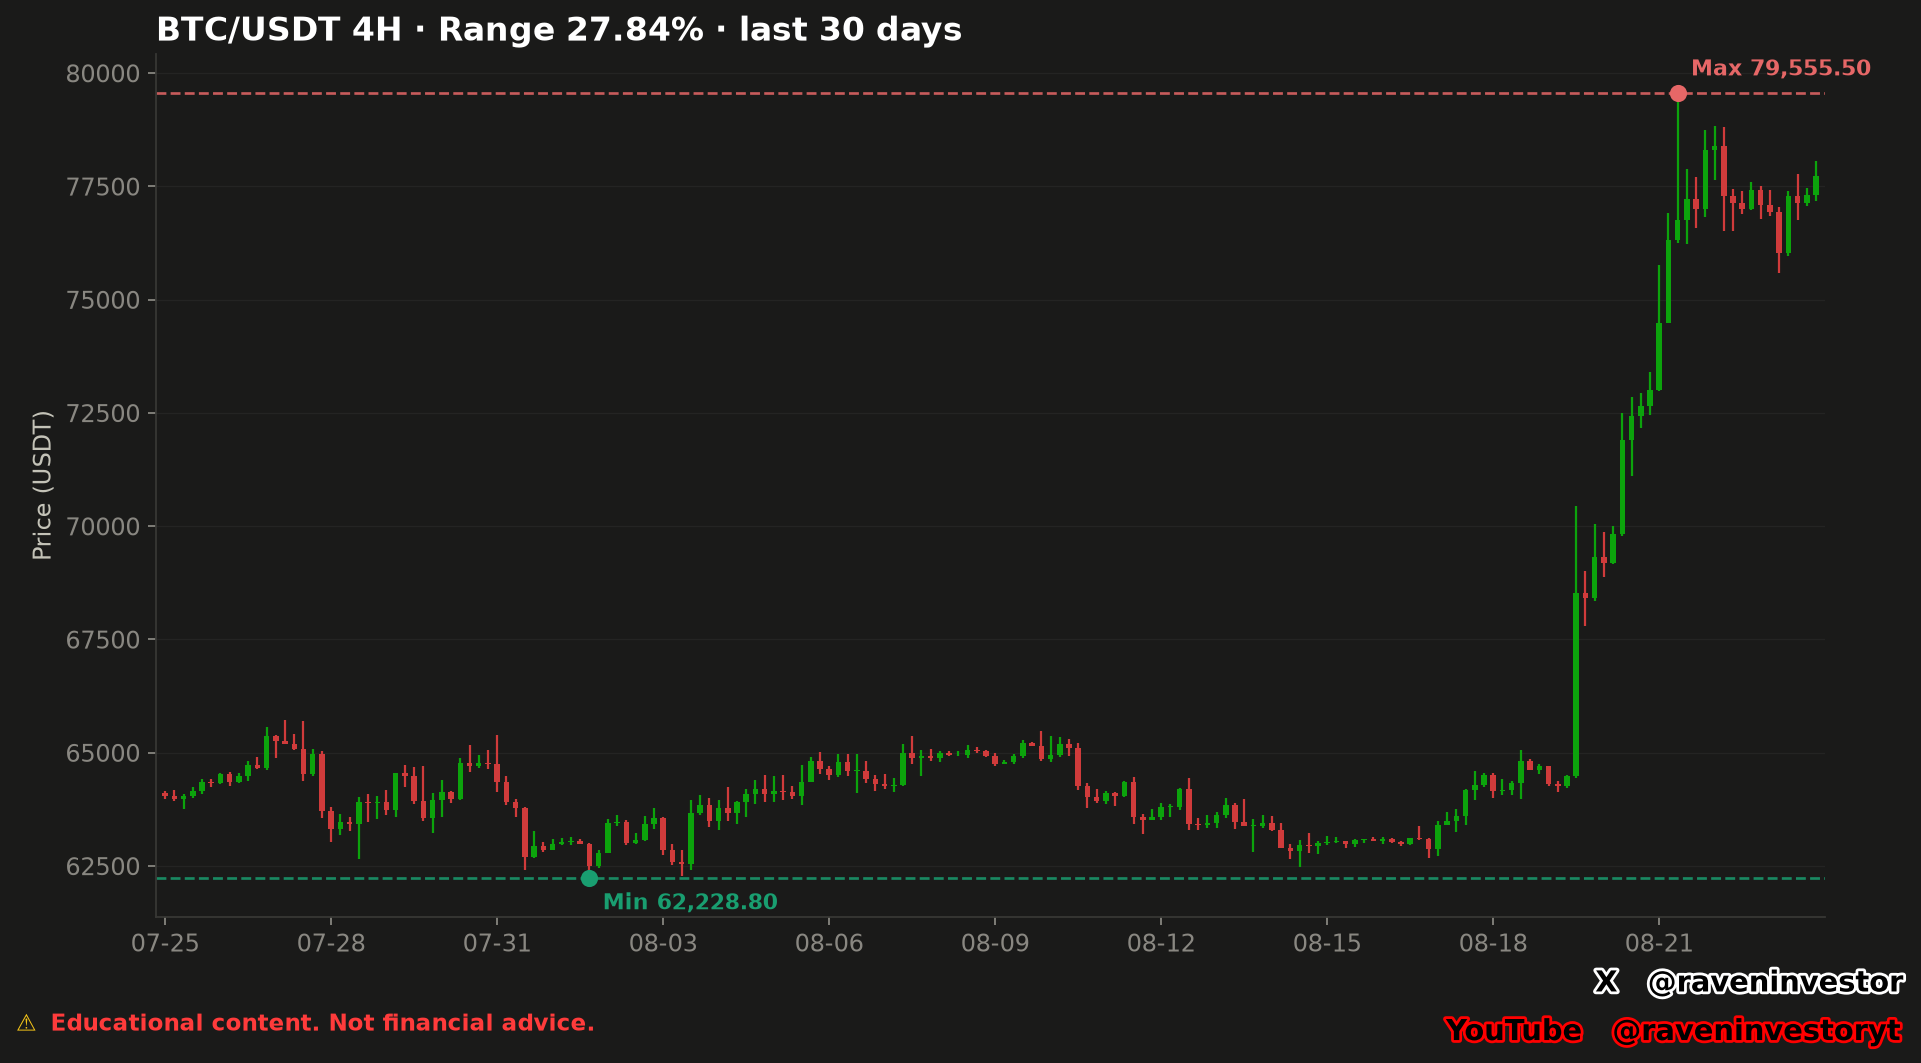
What the 30-day chart reports
The supplied BTC/USDT chart reports a 27.84% range across its last 30 days of 4-hour observations. It marks the period maximum at 79,555.50 USDT and the period minimum at 62,228.80 USDT. These figures are transcribed directly from the image, agree with the supplementary report and were not recalculated for this analysis.
“Maximum” and “minimum” are conditional on the stated window. They identify the highest and lowest observations selected by the chart within those 30 days. The image does not describe either value as an all-time extreme or as a permanent market boundary.
How to read the image
The candlesticks represent 4-hour BTC/USDT observations. A green dashed line and green marker identify the minimum, while a red dashed line and red marker identify the maximum. Both lines extend across the chart so the two extremes can be compared with the rest of the visible path.
In the earlier and middle portions of the window, candles remain within the lower region of the chart. Near the right side, a sharp advance carries price through several higher regions before the maximum is recorded. The final visible candles remain below the marked maximum and above the marked minimum.
That sequence is an observation, not a causal explanation. The chart does not identify news, flows or another driver for the advance, so none is introduced here. The image does not label the last close; the supplementary report supplies it separately as 77,719.10 USDT.
What the 62,228.80 USDT minimum shows
The minimum marker appears in the earlier portion of the 30-day window. The reconstruction identifies 62,228.80 USDT as the lowest candle low, in the candle opening on August 1, 2026 at 16:00 UTC. Subsequent candles stay above that dashed line in the supplied image.
A minimum can provide a precise lower reference for the observed window. It does not, by itself, prove that buyers will defend the same price later or that the level must act as support in a new sample.
What the 79,555.50 USDT maximum shows
The maximum marker appears late in the window, after the visible advance. The reconstruction identifies 79,555.50 USDT as the highest candle high, in the candle opening on August 21, 2026 at 08:00 UTC. Later visible candles do not exceed the dashed line.
The maximum provides an upper reference for this dataset. It does not establish that future price must be rejected there, that the level is permanent resistance or that Bitcoin will definitely revisit it.
Where the closing price ended within the range
The supplementary report supplies a last close of 77,719.10 USDT and places it at 89% of the range, where 0% represents the minimum and 100% the maximum. This is the closing price of the historical window under analysis, not a current quote. The price and position are transcribed from the report without calculating new values.
Read together, the observations are specific: after recording the minimum and then the maximum, the sample ended with a close in the upper part of the interval but below its upper extreme. This location describes where price finished; it does not establish that the high will be exceeded or the low will hold.
Two percentages with different meanings
The 27.84% compares the high with the low using the low as its base. It is not the return from the beginning to the end of the 30 days and does not establish an investor’s realized gain. The 89% describes the close’s location within that interval: it is not a probability of a rise or a success rate.
Levels to watch
| Level (USDT) | Chart role | Candle opening (UTC) | Reported distance |
|---|---|---|---|
| 79,555.50 | 30-day maximum | 2026-08-21 08:00 | +2.36% |
| 62,228.80 | 30-day minimum | 2026-08-01 16:00 | −19.93% |
Both distances are quoted from the report relative to the historical last close of 77,719.10 USDT, not recalculated against today’s price. They describe distances to observed extremes, not targets, expected returns or probabilities. Whether either price later functions as support or resistance requires new observations beyond this sample.
Source, sample and range calculation
The reconstruction identifies the Binance USDⓈ-M BTCUSDT perpetual future and its public aggregate-trade archives as the source. RavenInvestor locally builds 1-second candles, then 1-minute candles and finally 4-hour candles for this analysis. These are data for that contract, not a combined measurement of all Bitcoin markets.
The sample consists of 180 four-hour candles. Their opening timestamps run from July 25, 2026 at 00:00 through August 23, 2026 at 20:00 UTC. The last timestamp identifies the opening of the final included candle, not its closing instant. Likewise, the extreme-price timestamps identify their candles rather than the exact minute each price was reached.
- The maximum is the highest
highin the window: 79,555.50 USDT. - The minimum is the lowest
lowin the window: 62,228.80 USDT. - The range is expressed as (maximum − minimum) / minimum × 100. The reported result is 27.84%.
The formula explains the supplied definition; the range, position and distances have not been recalculated for this article. No return or volatility estimate is added from these data.
Supporting report and traceability
The supporting report is a later reconstruction anchored to August 23, 2026, not a report preserved since original publication. Its high, low and range match the labels in the original image, which is retained. The last close, its position, the distances and candle timestamps come from the supplementary report.
The declared 3,386,930,944 aggregate-trade records and 2,451 days describe the overall database coverage, not this article’s 180-candle sample. The September 16 frozen cutoff concerns that database; it does not extend the analysis window.
The declared fingerprint is 509956408c4c801f. The report does not specify its algorithm or the files it covers and does not attach the 180 candles or full aggregation code. It provides documented provenance and results, but is not an independent audit or a claim that we have reproduced the calculations from raw data.
Methodology and risk note
The numerical findings come from the original RavenInvestor chart and the supplementary reconstruction. No new financial calculations were performed. The high and low are wick extremes: the report cautions that they may reflect a brief price spike rather than a sustained level. Changing the observation window can change both the extremes and the range. Neither the range nor the close’s position establishes future direction.
No historical comparison is included because the available sample size is one 30-day window. Historical similarity, if comparable samples are added later, would not guarantee the same future outcome.