What the supplied chart shows
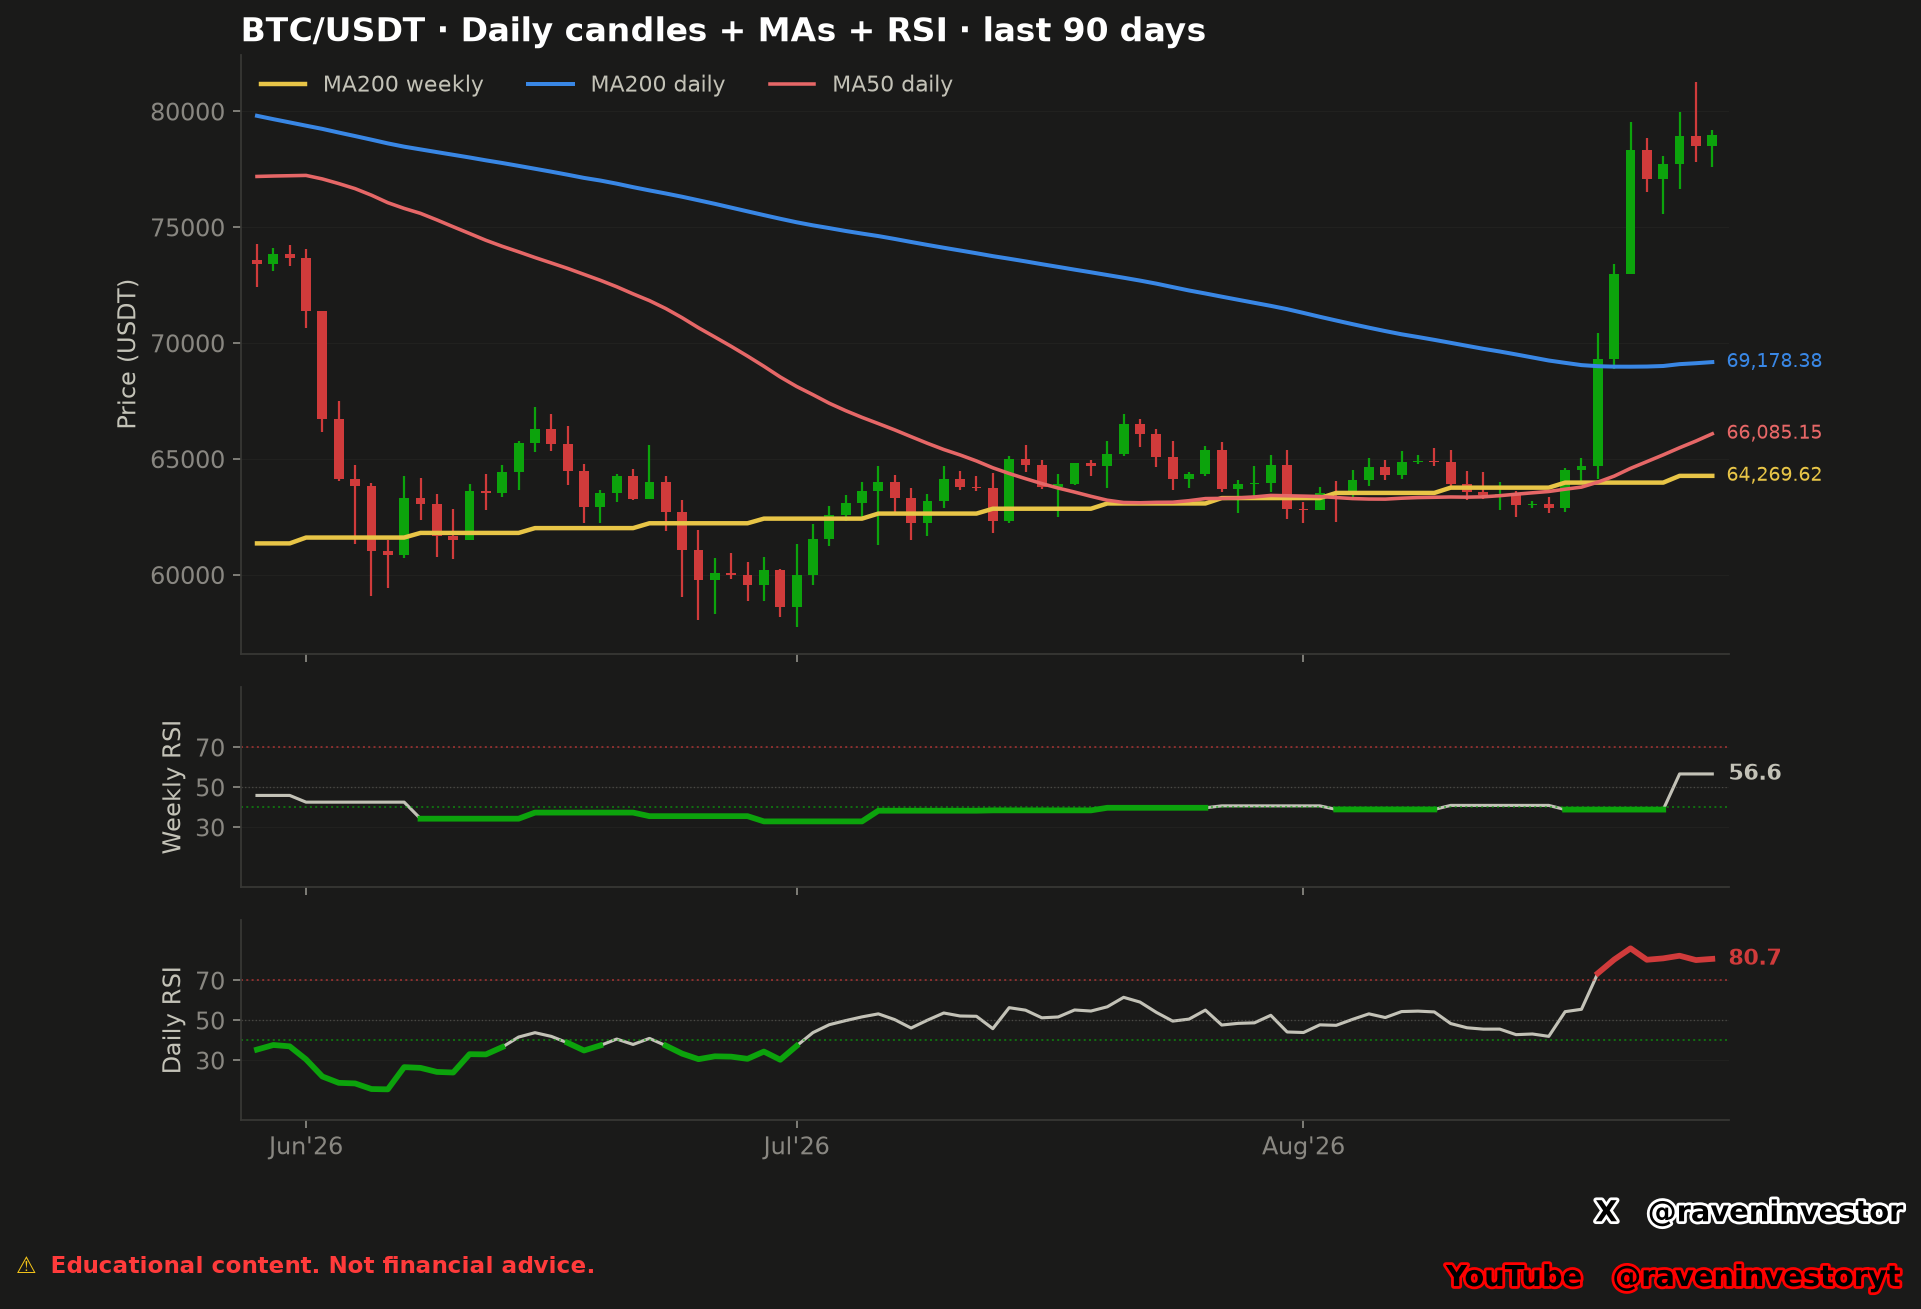
The chart covers one 90-day window of BTC/USDT daily candles. At the right edge it labels the daily MA200 at 69,178.38 USDT, the daily MA50 at 66,085.15 USDT and the weekly MA200 at 64,269.62 USDT. The latest visible candles sit above all three lines. The image does not label the exact final close; the reconstruction supplies 78,989.40 USDT for the final daily candle, referenced by its August 26, 2026 opening date.
The lower panels report daily RSI at 80.7 and weekly RSI at 56.6. The daily reading is shown above the red horizontal line at 70, while the weekly reading finishes above the dotted line at 50. These are observed relationships in the supplied image, not recalculated findings.
How the moving-average structure changed
The blue daily MA200 begins as the highest average in the chart and slopes downward through most of the window before flattening near the right edge. It ends at 69,178.38 USDT, still above the other two moving-average values shown.
The red daily MA50 also declines during the earlier and middle portions, then turns upward late in the sample to finish at 66,085.15 USDT. The yellow weekly MA200 follows a slower, step-like path and ends at 64,269.62 USDT. At the final observation, the displayed ordering is daily MA200 above daily MA50, and daily MA50 above weekly MA200.
Reported distances: the reconstruction places the final close +14.2% above daily MA200 and +22.9% above the reported weekly MA200. These percentages are transcribed, not recalculated. The weekly comparison inherits the alignment caveat documented below.
Interpretation: a close above all three averages coexists with daily MA50 below daily MA200. The report calls that daily-average ordering a bearish structure; it is a description of those averages, not a prediction of a price decline. Recent price recovery and the slower averages need not express the same configuration. Neither the ordering nor the positive distances establish that the averages will hold as support.
Daily RSI and weekly RSI are describing different horizons
The daily RSI rises sharply in the final segment and ends at 80.7, with the last portion highlighted red above the displayed 70 reference. The weekly RSI ends at 56.6, after a smaller late increase from the band occupied through much of the window.
Observed: short-horizon momentum is represented by the higher daily reading, while the weekly reading remains lower. Interpretation: the difference shows that the two aggregation periods are not expressing the same degree of momentum at the cutoff. It does not establish when either RSI will turn, nor whether price must reverse or continue.
The report specifies RSI with a 14-period lookback and Wilder smoothing. It classifies daily RSI at 80.7 as overbought under its stated red threshold above 70. That label describes the indicator; it does not make a subsequent fall inevitable. The report notes that extreme RSI readings can persist in a strong trend.
Other color-zone thresholds are described only as calibrated, without their full rules or calibration procedure. We do not infer them from the colors. RSI initialization is unspecified, and the weekly reading remains subject to the caveat below.
Levels to watch
The chart provides three exact moving-average reference levels. They are indicator outputs, not confirmed support or resistance:
- 69,178.38 USDT — daily MA200: the highest displayed moving-average value at the cutoff.
- 66,085.15 USDT — daily MA50: the faster daily average, rising near the right edge.
- 64,269.62 USDT — weekly MA200: the reported weekly reference shown by the yellow line, subject to the alignment caveat.
A future chart can observe whether price remains above, meets or moves below these rolling values. Because every average changes as new observations enter, the printed values are timestamped references rather than permanent price levels.
Comparison within the supplied 90-day window
The visible historical sample is one 90-day window containing 90 daily candles, from May 29 through August 26, 2026, in UTC. Earlier in the image, the daily RSI occupies lower areas and the weekly RSI stays closer to its lower reference band. At the end, daily RSI is labeled 80.7 and weekly RSI 56.6, while the final candles appear above all three moving averages.
No collection of earlier comparable events, percentile rank or forward-return study was supplied. The chart can document how its indicators changed within this sample, but it cannot establish how rare the configuration is or what usually happened afterward. Historical similarity does not guarantee the same future outcome.
Source, window and calculation parameters
The report identifies the Binance USDⓈ-M BTCUSDT perpetual future and its public aggregate-trade archives as the source. RavenInvestor locally builds 1-second candles, then 1-minute candles and finally daily and weekly candles. The chart window contains 90 daily candles, from May 29 through August 26, 2026, in UTC.
Each candle is referenced by its opening. The final date identifies the August 26 daily candle, not an execution time or a live quote. The last reported close is 78,989.40 USDT. Prices and moving averages are expressed in USDT; RSI is an indicator reading, not a percentage return.
| Indicator | Calculation window | Method |
|---|---|---|
| Daily MA50 | 50 daily closes | Simple moving average (SMA) |
| Daily MA200 | 200 daily closes | Simple moving average (SMA) |
| Weekly MA200 | 200 weekly closes | Simple moving average (SMA) |
| Daily RSI | 14 daily periods | Wilder smoothing |
| Weekly RSI | 14 weekly periods | Wilder smoothing |
The displayed 90 days are not the indicators’ entire input history. Daily MA200 and weekly MA200 require closes preceding that window. The visible sample and calculation periods must not be confused. Identifying SMA and Wilder smoothing improves the method description, but does not replace the input series or RSI initialization rule, which are not attached.
What remains unresolved about the weekly readings
The methodology states that weekly MA200 is aligned to the last complete week available for each day. However, the same report’s limitations warn that the latest weekly candle may still be in progress and that its RSI and moving average may change. The document does not specify how that warning applies to the published readings.
Accordingly, 64,269.62 USDT and 56.6 are retained as reported weekly values, not readings whose completed-period status has been independently verified. We do not assume that weekly RSI uses the same alignment as MA200 or that both values are final. Resolving this requires the dates of the weekly candles used and the rule for including or excluding the week in progress.
Supporting report and scope of the evidence
The supporting report is a later reconstruction anchored to August 26, 2026, not a report preserved since original publication. Its moving-average and RSI values match the labels in the original image, which is retained. The exact close, parameters and percentage distances come from the report, not visual estimates or new calculations.
The 3,386,930,944 aggregate-trade records and 2,451 days describe the declared overall database coverage, not the visible 90-candle sample. The September 16 frozen cutoff concerns the reconstruction database and does not extend the chart window. The declared fingerprint is 6d1f25daa88eefec; its algorithm and included files are unspecified.
The file is retained in full, including the weekly caveat noted above. It does not attach the complete series or aggregation and indicator code. This documentation does not constitute an independent audit, and we do not claim to have reproduced its results from raw trades.
Methodology and risk note
This analysis combines observations from the original RavenInvestor chart with the later reconstruction’s declared source, parameters and results. No new financial calculations were performed. SMA and RSI describe historical inputs; the supplied readings are not a backtest of a trading rule or evidence of its profitability.
Moving averages and RSI summarize historical price inputs and can change as the window advances. A high daily RSI, a lower weekly RSI or price positioned above an average does not guarantee that Bitcoin will rise, fall, reverse or repeat the path shown in this sample.