How to read this BTC/USDT chart
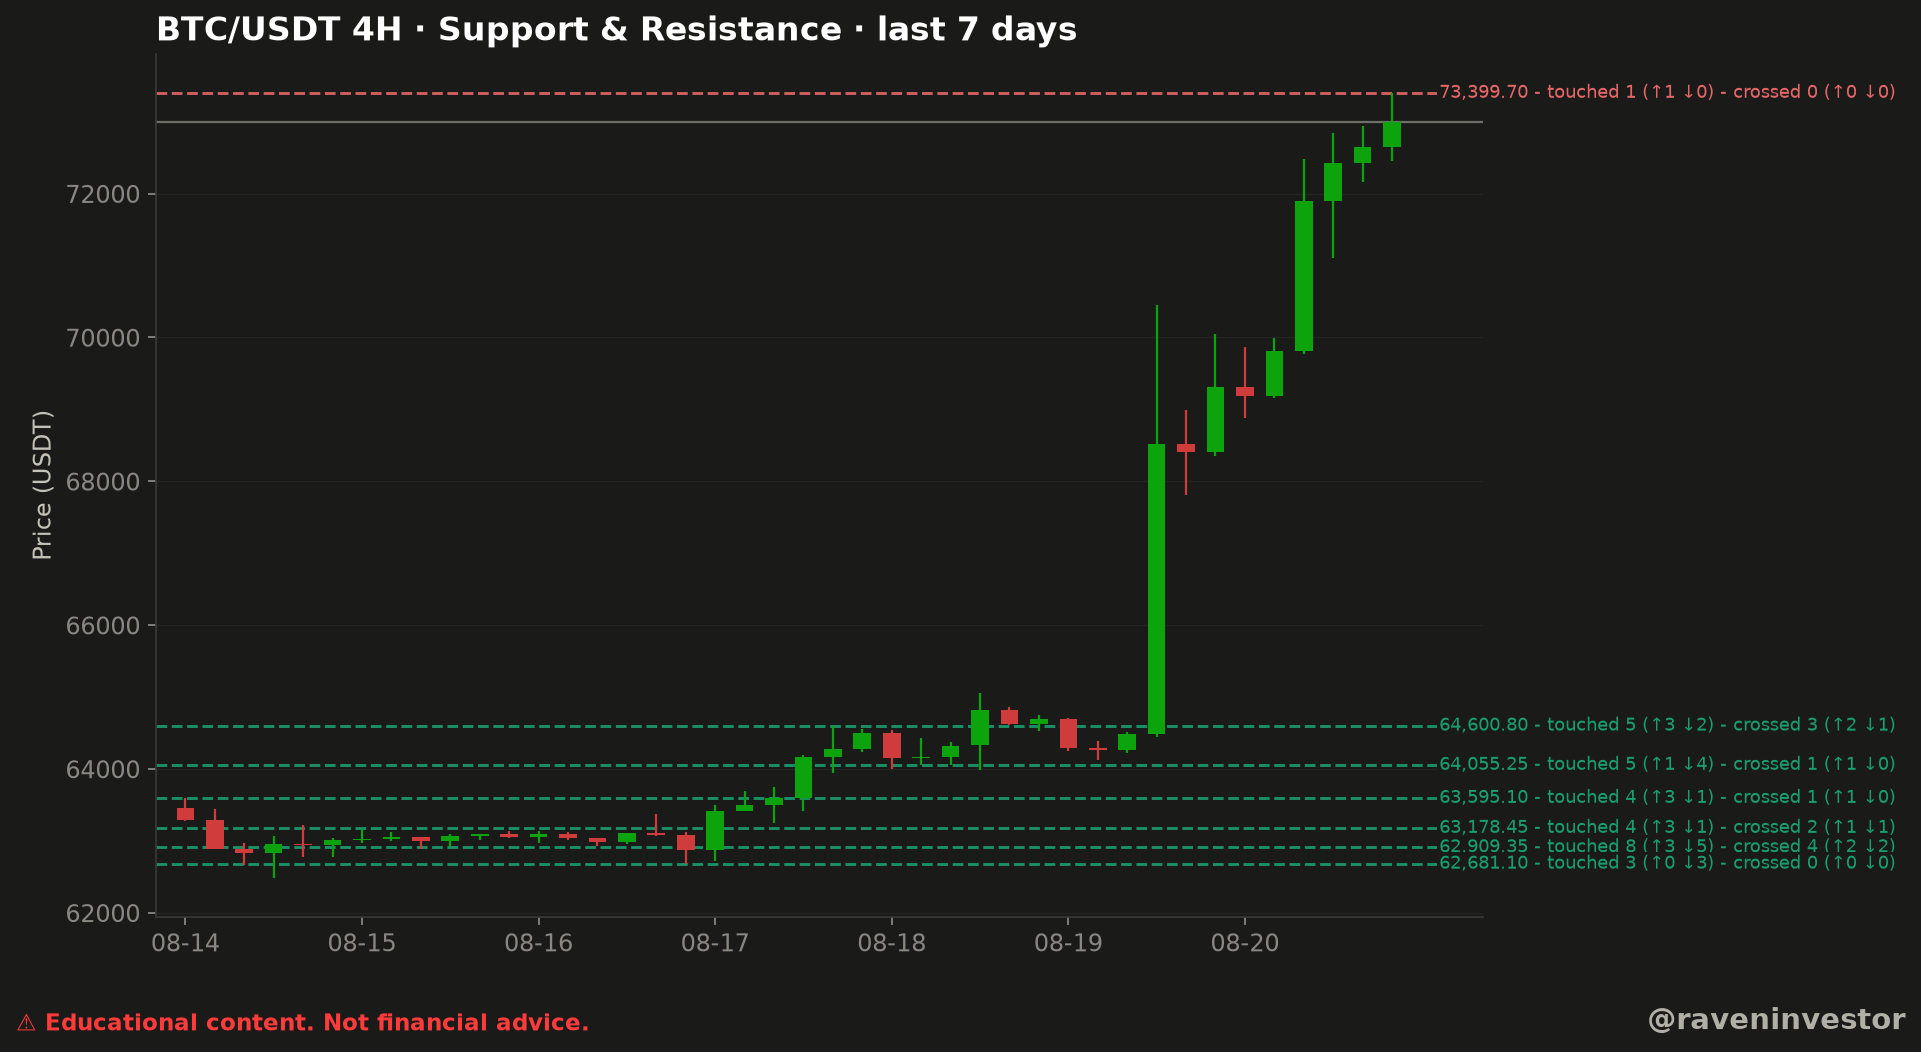
The chart displays BTC/USDT 4-hour candles across dates labeled August 14 through August 20. Six green dashed lines are marked as support below the late candles visible on the right. One red dashed line is marked as resistance at $73,399.70.
The resistance at $73,399.70
The resistance annotation reports 1 touch, broken down as one upward interaction and no downward interaction. It reports 0 crosses. The final visible candles advance into the area of that line. The reconstruction supplies a final close of 72,998.70 USDT, below the level, but no later confirmation. The evidence therefore supports describing a test of the marked resistance—not a confirmed breakout or a forecast.
The six-level support cluster
The marked supports are $64,600.80, $64,055.25, $63,595.10, $63,178.45, $62,909.35, and $62,681.10. Their annotations show that the levels did not all behave in the same way during the visible sample.
At $62,909.35, the chart reports the largest interaction count: 8 touches and 4 crosses. The touch count is divided into 3 upward and 5 downward interactions; the cross count is divided evenly between 2 upward and 2 downward crosses. This identifies the most repeatedly interacted-with displayed level, but does not make it a guaranteed floor.
Both $64,600.80 and $64,055.25 record 5 touches. Their directional counts differ: $64,600.80 shows 3 upward and 2 downward touches, while $64,055.25 shows 1 upward and 4 downward touches. The chart reports 3 crosses at the former and 1 at the latter.
The lowest marked support, $62,681.10, records 3 downward touches and no crosses. That is a description of this chart’s seven-day output only. It is not evidence that the level will remain unbroken in another sample.
Levels to watch
| Level (USDT) | Role | Touches (up / down) | Crosses (up / down) | Reported distance from close |
|---|---|---|---|---|
| $73,399.70 | Resistance | 1 (1 / 0) | 0 (0 / 0) | +0.55% |
| $64,600.80 | Support | 5 (3 / 2) | 3 (2 / 1) | −11.50% |
| $64,055.25 | Support | 5 (1 / 4) | 1 (1 / 0) | −12.25% |
| $63,595.10 | Support | 4 (3 / 1) | 1 (1 / 0) | −12.88% |
| $63,178.45 | Support | 4 (3 / 1) | 2 (1 / 1) | −13.45% |
| $62,909.35 | Support | 8 (3 / 5) | 4 (2 / 2) | −13.82% |
| $62,681.10 | Support | 3 (0 / 3) | 0 (0 / 0) | −14.13% |
Distances are supplied by the reconstruction relative to 72,998.70 USDT. These are dated observation levels. A future interaction can result in rejection, acceptance, or a cross; the image does not determine which outcome will occur.
Source and sample for this analysis
The reconstruction report identifies the Binance USDⓈ-M BTCUSDT perpetual future and its public aggregate-trade archives as the source. RavenInvestor locally builds 1-second candles, then 1-minute and finally 4-hour candles. Levels and interaction counts are outputs of RavenInvestor’s method, not official support levels published by Binance.
The specific window contains 42 four-hour candles, from August 14, 2026 at 00:00 through August 20, 2026 at 20:00 UTC. Each timestamp identifies a candle’s opening, not its close. The last reported close is 72,998.70 USDT: the historical reference for this sample, not a live quote.
How levels were selected and classified
- Local highs and lows are identified by comparing each candidate with a fixed neighborhood of candles.
- Nearby pivots are grouped using a price tolerance configured for the four-hour timeframe.
- A touch is counted when a level lies between a candle’s low and high. A cross is recorded when the close moves to the other side of the level. Arrows indicate the interaction’s direction.
- Levels above the reference close are labeled resistance and those below it support. Selection on each side considers grouped pivots and touch counts.
The report describes the process but does not provide the numerical neighborhood size, exact tolerance or complete ranking rule. Without those parameters, the selection cannot be reproduced exactly. Roles are also assigned relative to the final close: a label does not mean a level acted as support or resistance throughout the entire window.
What distances and interactions reveal
The nearest selected resistance is 73,399.70 USDT, +0.55% from the reported close. The nearest selected support is 64,600.80 USDT, −11.50%. The distribution is asymmetric around the close: the upper reference is nearby, while selected supports lie in a more distant lower region.
This describes the method’s selection, not a space with no possible support. It does not establish that price must fall to 64,600.80 or that intermediate levels could not be identified using another window or tolerance. Proximity to resistance does not establish an imminent breakout either.
More interactions do not establish a safer barrier
At 62,909.35 USDT, eight touches and four crosses are recorded within the 42 candles. Two upward and two downward crosses show movement between both sides. It is the published level with the most interactions, but these counts do not demonstrate consistent defense or a probability of a bounce.
Resistance at 73,399.70 has one touch and no crosses, offering limited evidence of repeated tests. Meanwhile, 62,681.10 records three touches and no crosses: the absence of crossings in this sample does not guarantee that the level will remain intact afterward.
The combined reading separates three questions: where each level sits relative to the close, how often it was interacted with, and whether crossings occurred. None, individually or together in this report, constitutes a validated success rate.
Supporting report and verification limits
The document is a later reconstruction anchored to August 20, not a report preserved since original publication. Its seven levels and touch and cross counts match those published in the image. That agreement is not an independent audit of the underlying data and calculations.
The declared 3,386,930,944 records and 2,451 days describe overall database coverage, not this seven-day sample. The September 16 frozen cutoff concerns the database used for reconstruction; it does not extend the analyzed window. The declared fingerprint is a55796abf391f8d3, but the document does not detail its algorithm or covered files.
Table distances are transcribed from the report without new calculations. The document’s maximum-penetration column is not used as an article finding: its formula, direction and candle set need clarification. It should not be interpreted as the size of a confirmed breakout.
Methodology and risk note
This analysis combines the original image with RavenInvestor’s historical reconstruction. The method studies price geometry; it does not incorporate volume or the order book into level selection. Changing pivot grouping can change the selected levels. A seven-day, 42-candle window supports a short-window description, not a validated long-term market structure.
No historical comparison is included because no valid comparison sample was provided. Historical similarity, when available, would not guarantee the same future outcome.