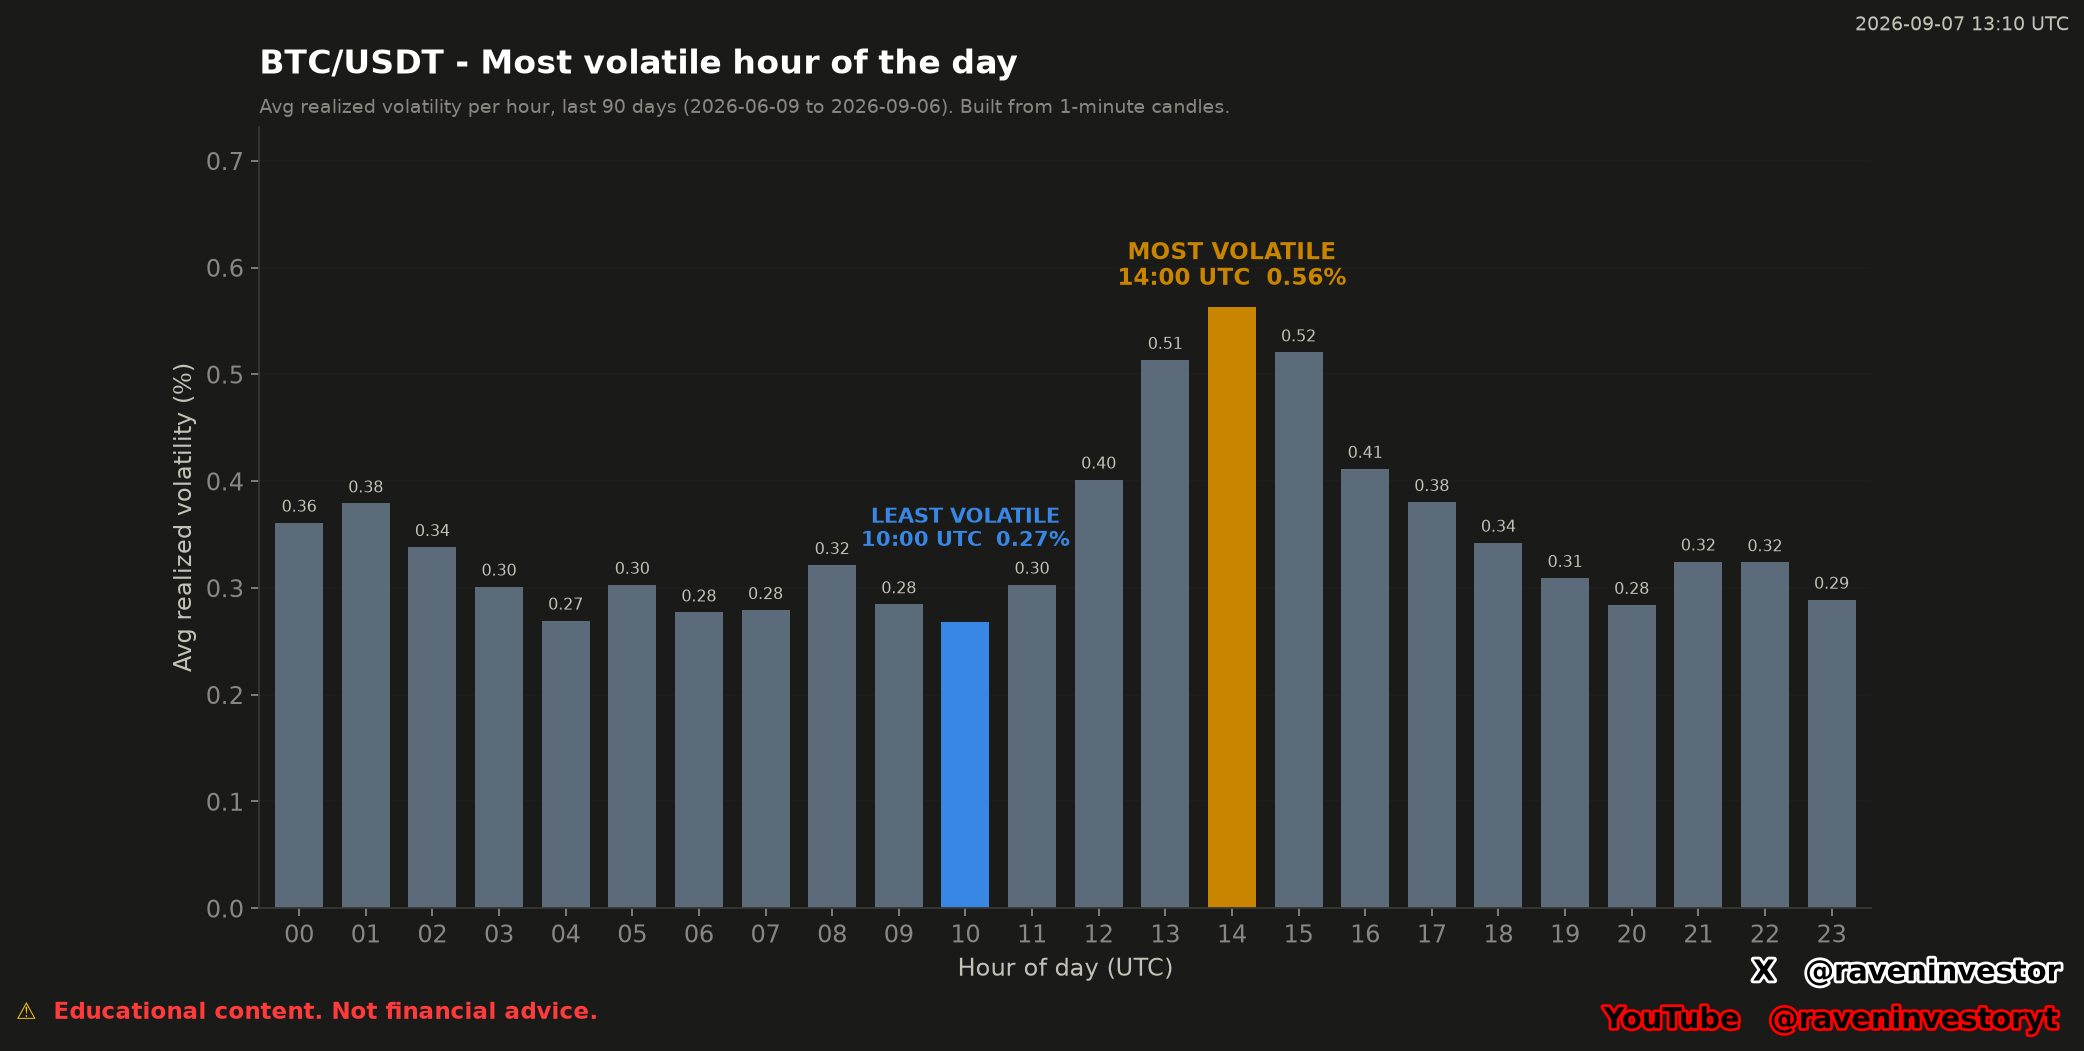
What the supplied chart reports
Observed: the chart designates 14:00 UTC as the most volatile hour, with average realized volatility of 0.56%. It designates 10:00 UTC as the least volatile hour at 0.27%. These are historical averages for the supplied window, not statements about what must happen at those hours on a future day.
The profile covers 90 days, from June 9 through September 6, 2026, and is built from 1-minute candles. Each bar represents one UTC hour of the day, so the figure compares 24 time-of-day groups under one displayed method.
How to read the hourly profile
The horizontal axis runs from 00:00 to 23:00 UTC. Bar height is the supplied average realized-volatility reading for that hour across the selected sample. A taller bar indicates a higher historical average under the chart's method; it does not show whether price moved upward or downward.
The strongest visible cluster surrounds the highlighted hour. The chart labels 12:00 at 0.40%, 13:00 at 0.51%, 14:00 at 0.56%, 15:00 at 0.52% and 16:00 at 0.41%. This is an observed concentration in the supplied profile. The image does not provide evidence explaining why those readings occurred.
At the displayed two-decimal precision, both 04:00and 10:00 are labeled 0.27%. The report resolves this apparent tie: 04:00 is 0.269%, while 10:00 is 0.268%. Both display as 0.27% at two decimal places, but their reported three-decimal values are not equal. The minimum designation is therefore supported by the report’s finer precision; no hypothetical tie-breaking rule is needed.
All 24 hours, to three decimals with sample counts
This table transcribes the reconstruction report: 90 measurements for each UTC hour, one per day in the window. The readings were not recalculated. Two-decimal labels remain in the original image; this table preserves the precision published in the document.
| UTC hour | Average (%) | Measured hours |
|---|---|---|
| 00:00 | 0.361 | 90 |
| 01:00 | 0.379 | 90 |
| 02:00 | 0.338 | 90 |
| 03:00 | 0.301 | 90 |
| 04:00 | 0.269 | 90 |
| 05:00 | 0.303 | 90 |
| 06:00 | 0.277 | 90 |
| 07:00 | 0.279 | 90 |
| 08:00 | 0.321 | 90 |
| 09:00 | 0.285 | 90 |
| 10:00 · Lowest | 0.268 | 90 |
| 11:00 | 0.303 | 90 |
| 12:00 | 0.401 | 90 |
| 13:00 | 0.513 | 90 |
| 14:00 · Highest | 0.563 | 90 |
| 15:00 | 0.520 | 90 |
| 16:00 | 0.411 | 90 |
| 17:00 | 0.380 | 90 |
| 18:00 | 0.342 | 90 |
| 19:00 | 0.309 | 90 |
| 20:00 | 0.284 | 90 |
| 21:00 | 0.325 | 90 |
| 22:00 | 0.324 | 90 |
| 23:00 | 0.289 | 90 |
The peak at 14:00 UTC, 0.563%, sits beside readings of 0.513% at 13:00 and 0.520% at 15:00. Concentration around the highlighted hour is an observation about the average profile, not evidence that this ranking repeated every day.
The report states that the peak is 2.1 times the minimum, the average of the hourly readings is 0.348%, and the peak is 62% above that average. These comparisons are transcribed from the document, without new financial calculations.
The 0.348% figure is not daily volatility. It is the average of the profile’s hourly readings. It is not an expected return either. A difference between averages does not by itself establish statistical significance or identify the best hour to trade.
Historical comparison: 90 days and 24 hourly groups
The valid comparison sample stated by the chart is a 90-day window, summarized into 24 UTC hourly groups. It is a time-of-day comparison within one historical period, not a comparison among separate market cycles, exchanges or instruments.
The report supplies 90 measurements for each hourly group and 129,600 one-minute candles for the window. It does not provide the distribution of individual days inside each group. Those counts therefore do not establish how consistent an hour was, whether a few sessions influenced the mean or how data-quality filtering affected the readings.
Historical similarity does not guarantee the same future outcome. Even if a future session reaches 14:00 UTC, the chart does not imply that its volatility will equal 0.56% or exceed every other hour that day.
What the profile can—and cannot—support
Interpretation: the supplied profile can help identify hours that merit closer monitoring, compare the same UTC bucket across later samples and describe when variability was historically concentrated. It can also support research on whether the ranking remains stable when the sample window or measurement method changes.
Under the documented method, each calendar-hour reading measures the magnitude of minute-to-minute log-price changes through a sum of squared returns, followed by a square root. Higher bars represent higher averages of that measure, not necessarily greater dispersion around a mean. Neither source identifies what caused the readings; explanations involving news, liquidity, order flow or derivatives would require separate evidence.
The measure also does not provide direction. A high reading can describe movement without determining whether the net move was positive or negative. No support, resistance, target, entry or liquidation level is supplied, so a “Levels to Watch” section is intentionally omitted.
Source and calculation of hourly volatility
The declared source is the Binance USDⓈ-M BTCUSDT perpetual future, through its public aggregate-trade archives. RavenInvestor locally constructs one-second and one-minute candles. The declared window contains 129,600 one-minute candles, from June 9 through September 6, 2026, in UTC. Candles are referenced by their opening.
- Within each calendar hour, log returns are obtained between consecutive minute closes belonging to that same hour.
- The square root of the sum of those squared returns is calculated and multiplied by 100 to express the measurement as a percentage.
- Measurements are grouped by UTC hour of day and averaged across the days in the window.
Formula per calendar hour: 100 × √Σr², where r is the log return between consecutive closes within that hour. The order matters: first calculate volatility for each calendar hour, then average by hour of day. Pooling all returns for one time-of-day group into a single sum would not describe the stated averaging procedure.
The formula does not center returns around their mean, so it is not simply a standard deviation. It is also not a high–low range, a net price change or an annualized rate. The restriction to closes within the same hour is part of the definition: we do not add returns spanning two hours or assume another convention.
The original chart is timestamped September 7, 2026 at 13:10 UTC; the data window ends on September 6. Hours are UTC, not the reader’s local time. Changing time zones requires identifying the date and applicable offset correctly, without changing which observations were measured.
Supporting report and verification limits
The report is a later reconstruction anchored to September 6, 2026, not a document preserved since original publication. It is provided in full for inspection of the declared source, formula, values and counts. It is not an independent audit, and we do not claim to have reproduced the results from the trade archives.
The 3,386,930,944 aggregate-trade records and 2,451 complete days describe the overall database coverage, frozen at September 16. They are not this hourly profile’s sample size and do not extend its window. The declared fingerprint is bde4fd21fde727d0; its algorithm and included files are unspecified.
The candles and individual calendar-hour measurements are not attached. Missing-minute handling, minimum observations for hour eligibility and outlier policy are also unspecified. Counts of 90 measurements per time-of-day group do not by themselves verify each record’s quality. The reading distributions and tests on other windows are needed to assess consistency and stability.
The profile combines weekdays and weekends without separate results. The document also provides no measurements of news, liquidity or the macroeconomic calendar that would attribute the peak to them. A historical mean can combine quiet sessions and extreme moves; it does not state on how many days 14:00 was actually the most volatile hour.
Methodology and risk note
This analysis distinguishes the original RavenInvestor image timestamped September 7, 2026 at 13:10 UTC from the later reconstruction anchored to September 6. The report adds the data source, calculation, three-decimal values and sample counts. No new financial calculations were performed.
The declared sample is 90 days, with 90 measurements per UTC hour. There is no supplied test of statistical significance, no breakdown of the daily ranking and no out-of-sample result. The highest historical average is not a guarantee that the same hour will lead on another day or offer the best trading outcome.
The profile shows an association between UTC hour and average measured variability in one sample. It does not prove that the hour caused the volatility, and it does not predict that Bitcoin will definitely rise or fall at any displayed time.