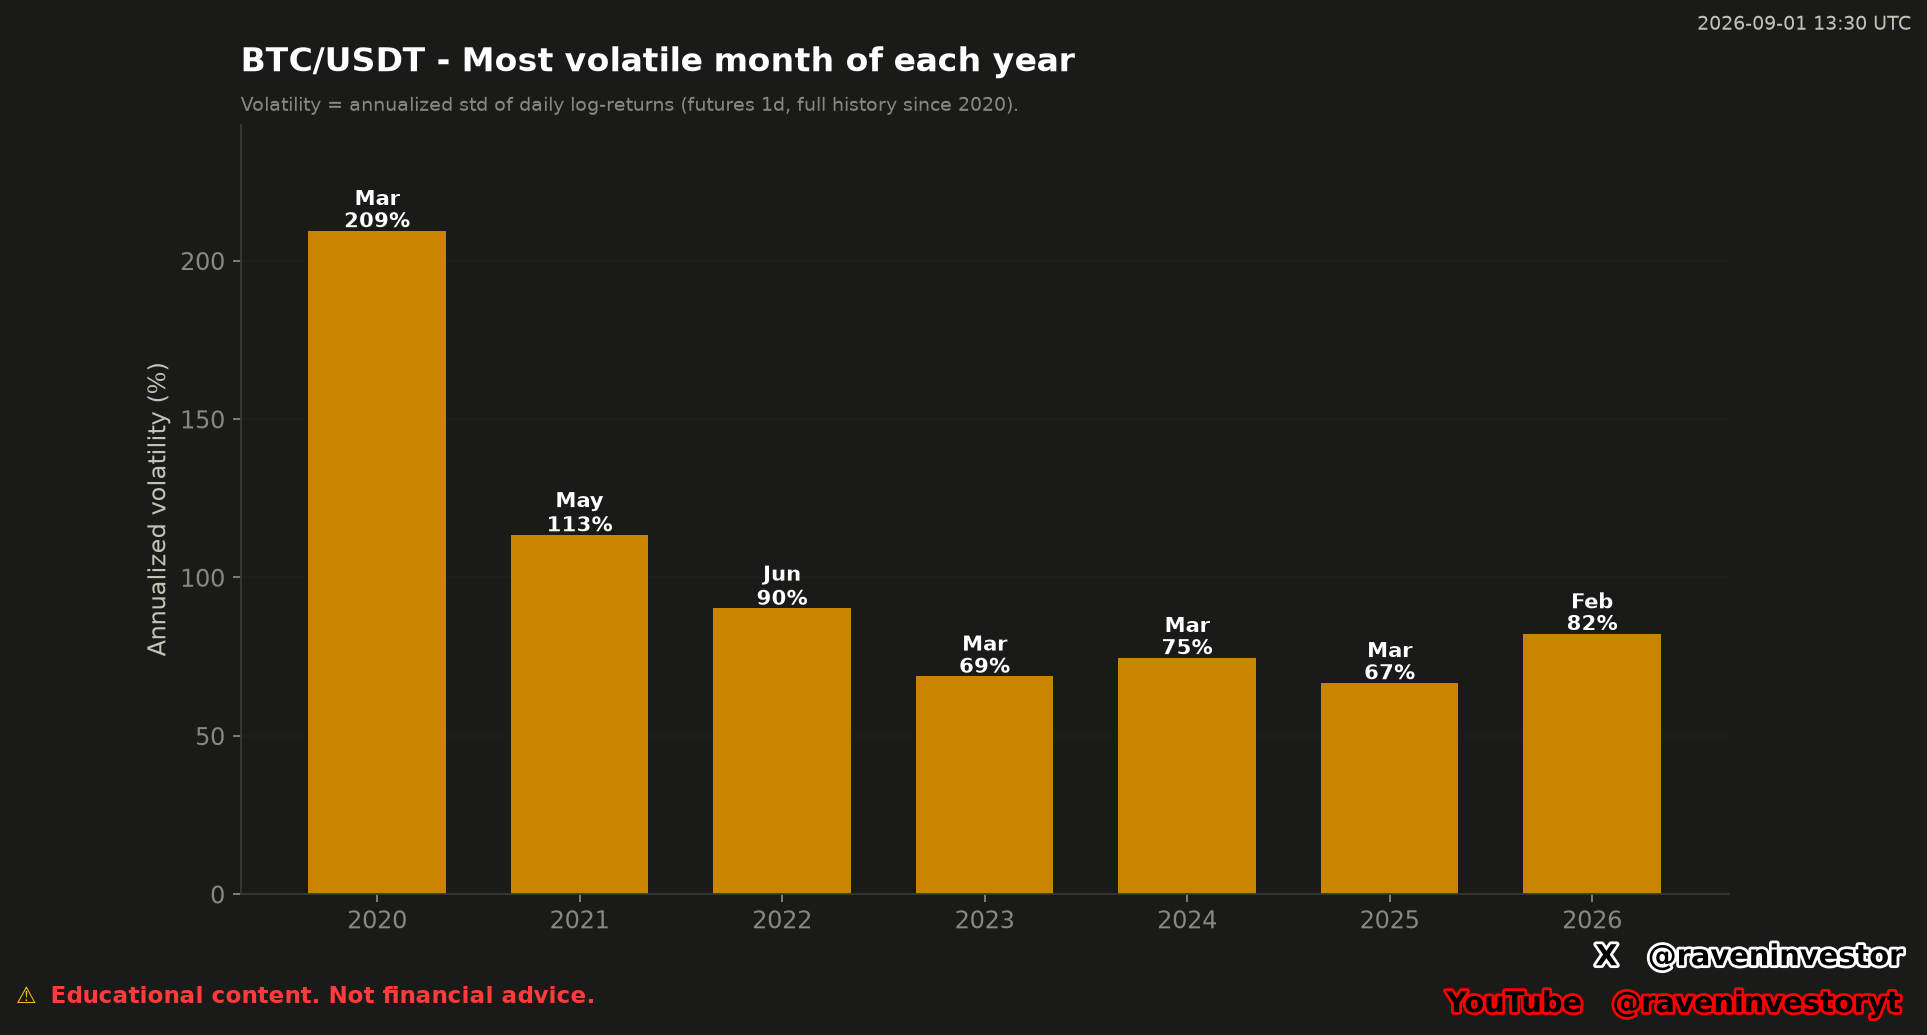
What the supplied chart reports
Observed: the chart selects one month for each supplied year. It reports March at 209% for 2020, May at 113% for 2021, June at 90% for 2022, March at 69% for 2023, March at 75% for 2024, March at 67% for 2025 and February at 82% for 2026.
Each bar is labeled as the most volatile month of its year under the supplied method. The metric is defined in the image as the annualized standard deviation of daily log returns using one-day futures history since 2020. The values above are transcribed from the image and were not independently recalculated.
The 2026 observation requires separate treatment. The chart is timestamped September 1, 2026, so 2026 is not a completed annual sample. February at 82% is therefore the highest month identified in the available 2026 history at that cutoff, not a final result for the full year.
Report results, to one decimal place
Each bar represents the selected monthly maximum within a year, not the volatility of the whole year. This table transcribes the reconstruction report’s figures. The original image and its integer labels are retained separately: the document does not explain the formatting rule behind those labels, so we do not claim they are all conventional roundings of these decimals.
| Year | Selected month | Annualized volatility |
|---|---|---|
| 2020 | March | 209.5% |
| 2021 | May | 113.5% |
| 2022 | June | 90.2% |
| 2023 | March | 68.8% |
| 2024 | March | 74.7% |
| 2025 | March | 66.7% |
| 2026 (partial) | February | 82.3% |
Within this sample of seven peaks, March 2020 has the highest reading, 209.5%. March 2025, at 66.7%, is the lowest of the selected annual peaks. This does not establish that 2025 had the lowest whole-year volatility: that would require a different measure, which is not supplied.
February 2026’s 82.3% reading is the highest among the months available through August 31. The comparison is not between seven completed years: the 2026 peak can change as the remaining months are included.
How annualized monthly volatility is obtained
The supplied definition begins with daily log returns. A daily log return expresses the change between consecutive daily closes as the natural logarithm of the current value divided by the preceding value. The monthly standard deviation then summarizes how dispersed those daily returns were within the month.
The report specifies the formula: standard deviation of the month’s daily log returns × √365 × 100. The square-root factor annualizes the daily dispersion and the final factor expresses it as a percentage. The method then compares the monthly estimates within each year and selects the highest. This describes the supplied calculation; no new financial calculations were performed for this article.
An annualized reading is a standardized expression of return variability. It should not be read as the percentage by which BTC/USDT rose or fell during that month. Direction and volatility answer different questions: the supplied bars describe dispersion, not whether the monthly price change was positive or negative. Annualizing a monthly estimate does not imply that its volatility will persist for a year.
Historical comparison: seven annual observations
The valid comparison sample contains seven annual observations, one for every displayed year from 2020 through 2026. March is the selected month in 2020, 2023, 2024 and 2025; May is selected in 2021, June in 2022 and February in the provisional 2026 observation.
The report summarizes March’s recurrence as four of seven years, including the partial 2026 comparison. This is a count among selected maxima, not the probability of March being most volatile next year. The other monthly readings are not supplied, so the table cannot show whether each selected month led its alternatives narrowly or by a large margin. It is not evidence of a stable calendar rule.
Historical similarity does not guarantee the same future outcome. A month matching a name or volatility reading from this sample would not establish that price direction, duration or subsequent behavior must repeat.
Why volatility differs from year to year
Interpretation: because the metric is built from daily log returns, a different distribution of those returns produces a different monthly standard deviation. Changes in the values and dispersion of the observations included in each month can therefore change which month ranks highest. The ordering of otherwise identical returns does not itself change their standard deviation.
The supporting report identifies the futures contract, UTC convention and annualization factor. Monthly eligibility, missing-data handling and the standard-deviation convention remain incompletely documented. Those choices matter when comparing this series with another volatility estimate.
The image does not supply external events or explanatory market variables. It therefore supports no claim that news, liquidity, leverage or another specific force caused any displayed reading. It shows measured differences; it does not identify their causes.
Volatility can be useful for comparing the intensity of return variation under a consistent method, identifying periods for deeper review and calibrating how unusual a month appears within a declared sample. It does not provide price direction or a guaranteed trading signal.
No price, support, resistance, target or liquidation level was supplied, so there is no “Levels to Watch” section.
Source and actual analysis sample
The report identifies the Binance USDⓈ-M BTCUSDT perpetual future and its public aggregate-trade archives as the data source. RavenInvestor locally builds one-second candles, then one-minute candles and finally daily candles. The declared window runs from January 1, 2020 through August 31, 2026, in UTC, and contains 2,435 daily candles. Each candle is referenced by its opening.
The 2,435 records are candles, not a documented count of valid returns per month. The report lists calendar days for the selected months—31, 30 or 28 depending on the month—but those durations do not establish how many returns actually entered each standard deviation. We do not fill in those sample counts or assume an absence of missing data.
The original chart is timestamped September 1, 2026 at 13:30 UTC. That date identifies the chart; it does not extend the data window beyond August 31. The source is a specific futures contract, not a combined measure of all Bitcoin markets.
Supporting report and verification limits
The document is a later reconstruction anchored to August 31, 2026, not a report preserved since original publication. It is provided in full so readers can inspect the declared source, formula and results. It is not an independent audit, and we do not claim to have reproduced the calculations from the trade archives.
The declared overall database coverage—3,386,930,944 aggregate trades and 2,451 complete days, frozen at September 16—is not this article’s sample or a set of independent tests. The declared fingerprint is 1f8ca3fcf411357f; the document does not specify its algorithm or the files included.
Specific limits remain: a minimum number of days with data is required for month eligibility, but that number is omitted. The report also does not state whether the standard deviation is sample or population, how missing values are handled or which rule applies to incomplete months. The daily series, full list of monthly estimates and calculation code are not attached. Readers can inspect the reported results, but cannot fully verify their selection from this document alone.
Methodology and risk note
This analysis distinguishes the original chart timestamped September 1, 2026 at 13:30 UTC from its later supporting reconstruction. The chart labels and report decimals are attributed separately, without assuming an undocumented rounding rule. No new financial calculations were performed.
The sample begins in 2020 and cannot describe earlier Bitcoin cycles. The seven annual selections include an incomplete 2026; they are not seven full-year volatility estimates. A monthly standard deviation may also be sensitive to an extreme daily return, so the selected peak does not describe every day of its year.
The annual maxima are historical and method-specific. They do not predict that Bitcoin will rise or fall, identify a recurring month that must remain most volatile, or guarantee that any future sample will resemble these seven observations.