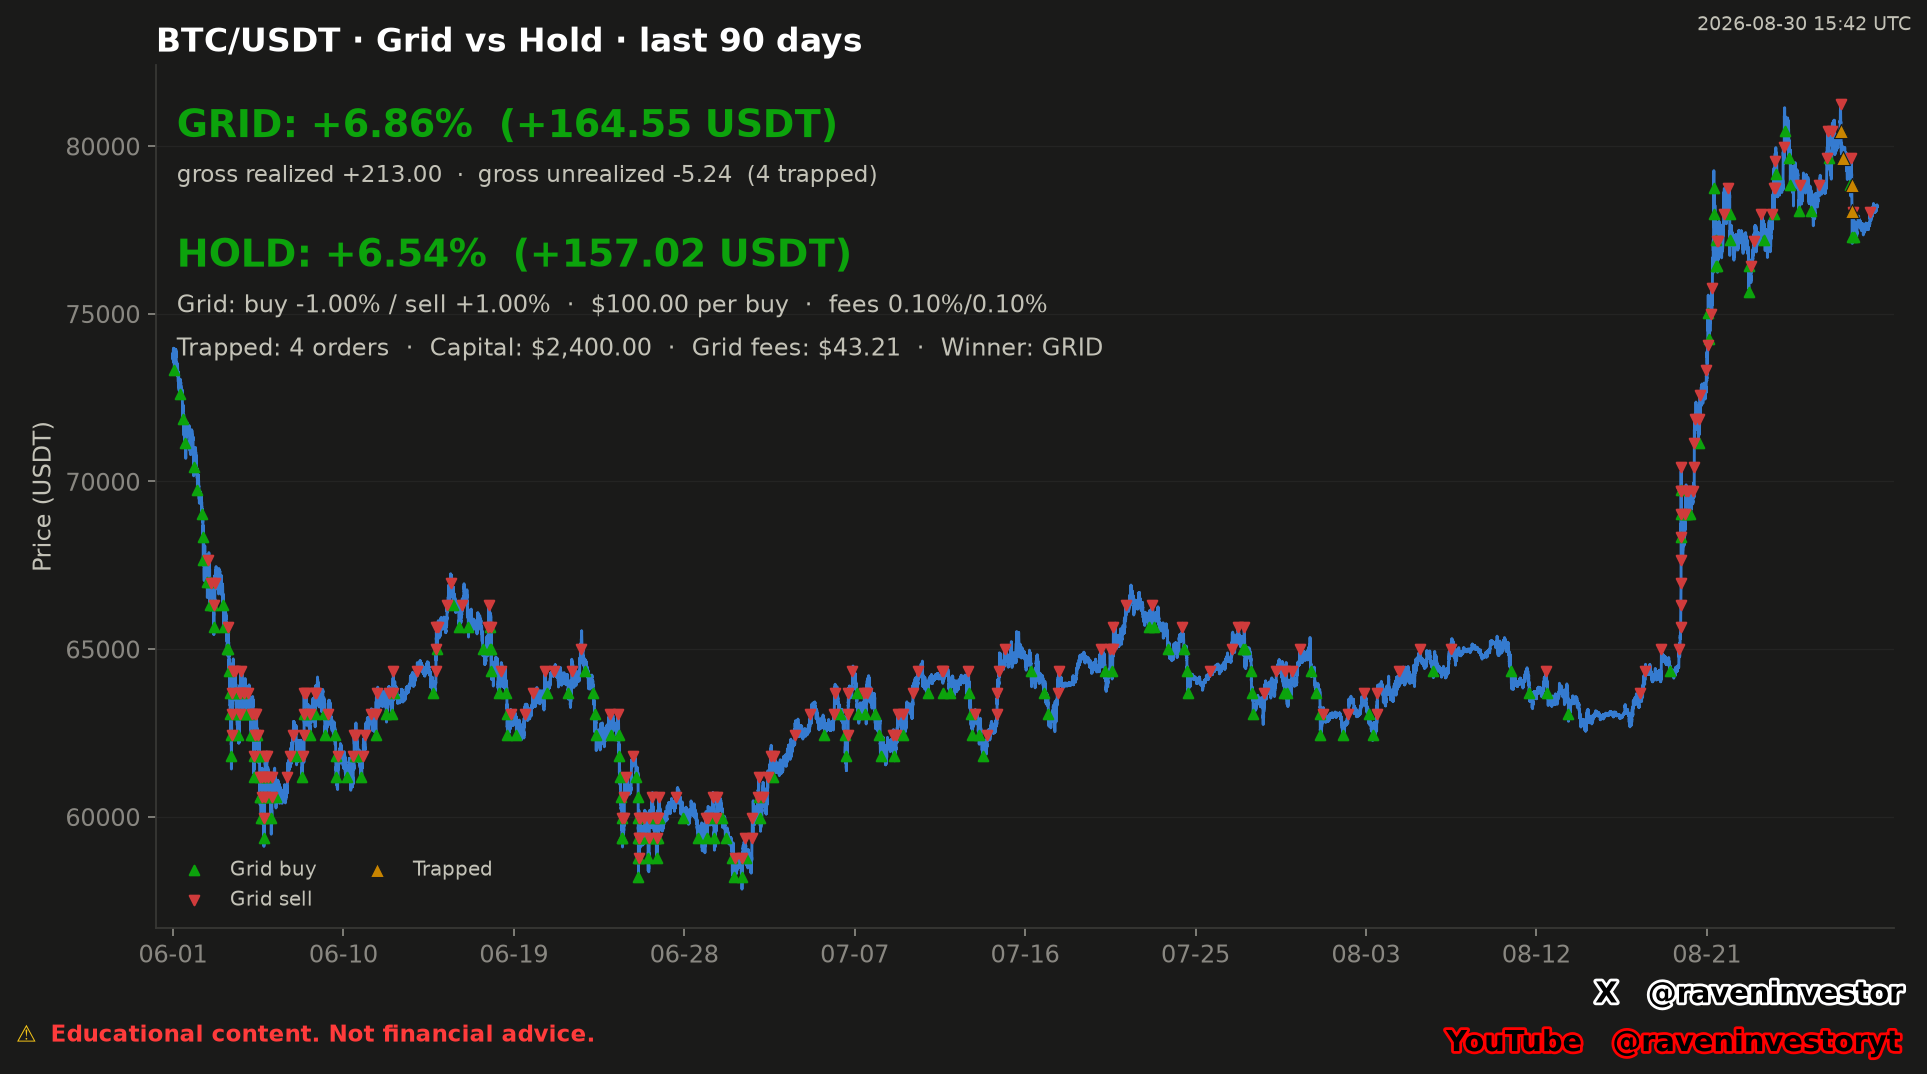
What the supplied 90-day comparison reports
Observed: the chart reports a grid result of +6.86% (+164.55 USDT) and a hold result of +6.54% (+157.02 USDT). It labels the winner as GRID. These figures are transcribed from the supplied image and were not independently recalculated.
The grid configuration is displayed as a buy trigger of −1.00%, a sell trigger of +1.00%, $100.00 per buy and fees of 0.10%/0.10%. The chart also reports $2,400.00 in capital and $43.21 in grid fees.
How to read the image
The blue line traces the BTC/USDT price path across the supplied window. Green upward triangles mark grid buys, red downward triangles mark grid sells and orange triangles mark trapped orders. The markers show where the modeled rules recorded actions; they do not by themselves disclose every fill assumption or the complete order ledger.
The price line declines during the earlier portion of the chart, moves through a broad middle area and rises sharply near the right side. Buy and sell markers appear throughout those different paths. This is an observation about the picture, not an explanation of what caused the market move.
The result block separates gross realized +213.00from gross unrealized −5.24 and associates the latter with four trapped orders. That separation matters because completed activity and positions still open at the endpoint are not the same type of result. The chart does not supply individual order records, so no further reconciliation is attempted here.
How hold was constructed and which capital was matched
The report assigns 2,400.00 USDT to each strategy for comparison. Hold buys with all that capital at the grid’s first purchase, at 73,329.79 USDT, and retains the position. The exact entry timestamp is not supplied; we do not automatically equate it with the start of the window.
The capital reference is the peak simultaneous capital required by the grid during the simulation. It is identified from the historical path, not a guaranteed capital requirement for future execution. Matching that base allows comparison of the reported monetary results, but does not mean both strategies maintained identical exposure at every moment or assumed the same risk.
The grid pays a fee on every operation; hold pays a single entry fee. Hold is valued at the window’s closing price: a final sale and its associated fee are not simulated. Its result is therefore a valuation of the retained position, not profit collected after liquidating it.
What makes up the result and separates the strategies
The table transcribes the results and difference published in the report. No new financial calculations were performed. Amounts in this breakdown are expressed in USDT, as identified in the document.
| Metric | Reported result |
|---|---|
| Final grid result | +164.55 USDT (+6.86%) |
| Hold result | +157.02 USDT (+6.54%) |
| Reported grid advantage | 7.53 USDT |
| Grid operations | 430 |
| Completed sells | 213 |
| Gross realized grid result | +213.00 USDT |
| Gross unrealized grid result | −5.24 USDT |
| Grid fees | 43.21 USDT cost |
| Trapped orders at the endpoint | 4 |
The grid’s final +164.55 USDT result incorporates the reported unrealized component and fees; it is not entirely realized profit. The +213.00 USDT figure is the gross realized component, not total net profit. The four trapped orders retain capital exposure at the endpoint; their individual prices and records are not supplied.
The 430 operations and 213 sells describe activity within the same test. They are not 430 independent trials or a sample size that establishes superiority in other periods. They also do not make the 7.53 USDT difference a statistically demonstrated advantage.
What the grid-versus-hold comparison can show
Interpretation: within this one supplied 90-day window and under the displayed grid settings, the published grid result is higher than the published hold result. The chart’s “Winner: GRID” label is therefore a description of this test endpoint, not evidence that grid is generally superior or that it will outperform in another window.
Hold provides a useful reference because it asks what the same capital basis would have done without the repeated grid actions. The report identifies a 7.53 USDT advantage for grid under its assumptions. This is an endpoint difference, not evidence of better risk-adjusted performance: no comparable drawdown or capital-exposure paths were supplied for the two strategies.
Grid carries information that the hold headline does not: the chart reports explicit grid fees, repeated buy and sell rules, realized and unrealized components, and trapped orders. Those details help explain the structure of the reported grid result without establishing causality or supporting a forecast.
Historical comparison: one shared 90-day sample
The valid comparison contains one historical sample: a single 90-day BTC/USDT window. Within that same sample, two approaches are shown: grid and hold. No second 90-day period, out-of-sample test or collection of repeated trials was supplied.
The comparison can describe how the two published results finished in this shared window. It cannot establish robustness across other market paths. Historical similarity does not guarantee the same future outcome, even if another period appears visually comparable.
Source, window and simulation conditions
The declared source is the Binance USDⓈ-M BTCUSDT perpetual future, through its public aggregate-trade archives. RavenInvestor locally builds 1-second candles and then 1-minute candles. The window contains 129,600 one-minute candles, from June 1, 2026 at 00:00 UTC through August 29, 2026 at 23:59 UTC. Each candle is referenced by its opening.
The report describes fixed-amount purchases after a configured step down and sales one step above. The original image supplies the displayed settings: buy −1.00%, sell +1.00%, $100.00 per buy and fees of 0.10%/0.10%. The exact reference price for each trigger, calibration procedure and execution sequence when a candle reaches several levels are not documented.
This is a historical simulation, without real orders or slippage. Financing costs and perpetual funding are also excluded. The price source does not turn this test into a live execution record. The result is conditional on the rules and costs included, not all possible costs of trading.
The original chart’s August 30, 2026 at 15:42 UTC timestamp does not extend the window beyond August 29. The endpoint determines the valuation of hold and still-open grid positions; no alternative exit date was supplied to test how the comparison would change.
Supporting report and verification limits
The supporting report is a later reconstruction anchored to August 29, 2026, not a report preserved since original publication. It complements the original image with the source, hold rules, comparison capital, breakdown and simulation limits.
The 3,386,930,944 aggregate-trade records and 2,451 days describe the declared overall database coverage, not independent trials of these strategies. The September 16 frozen cutoff belongs to the reconstruction database and does not extend the 90-day sample. The declared fingerprint is 9b0c5f142fe8203b; its algorithm and included files are unspecified.
The complete candle series, individual trade ledger and simulator code are not attached. Partial fills, parameter selection, missing-data handling and each strategy’s maximum drawdown are also unspecified. The report allows inspection of the declared assumptions, but is not an independent audit; we do not claim to have fully reproduced the backtest.
The file is retained in full, but this analysis does not adopt its generalization that grid wins in sideways markets or that hold usually wins in uptrends. One window does not establish those relationships or support probabilities for future results.
Methodology and risk note
This article combines the original image with the supplied reconstruction report, separating reported results from interpretation. No new financial calculations were performed. The comparison is one historical simulation with documented cost exclusions and incomplete execution detail, not evidence of realized live-trading returns.
Neither the reported winner nor the chart’s price path predicts that Bitcoin will rise or fall. The observation is historical and specific to the displayed configuration and sample.