The observed setup and the comparison sample
The October 2 snapshot places BTC/USDT above its daily MA200, with RSI(14) at 63.0, ADX(14) at 41.6 and 30-day momentum of +9.3%. The report labels the regime bull using MA50 versus MA200 and gives a position-in-range reading of 0.77. These are the inputs describing the setup, not predicted returns.
The search finds 18 matching days and groups nearby matches into five distinct episodes. Five episodes—not 18 independent observations—form the comparison sample. Grouping nearby dates reduces repeated counting of the same episode, but does not establish that the remaining forward paths are statistically independent.
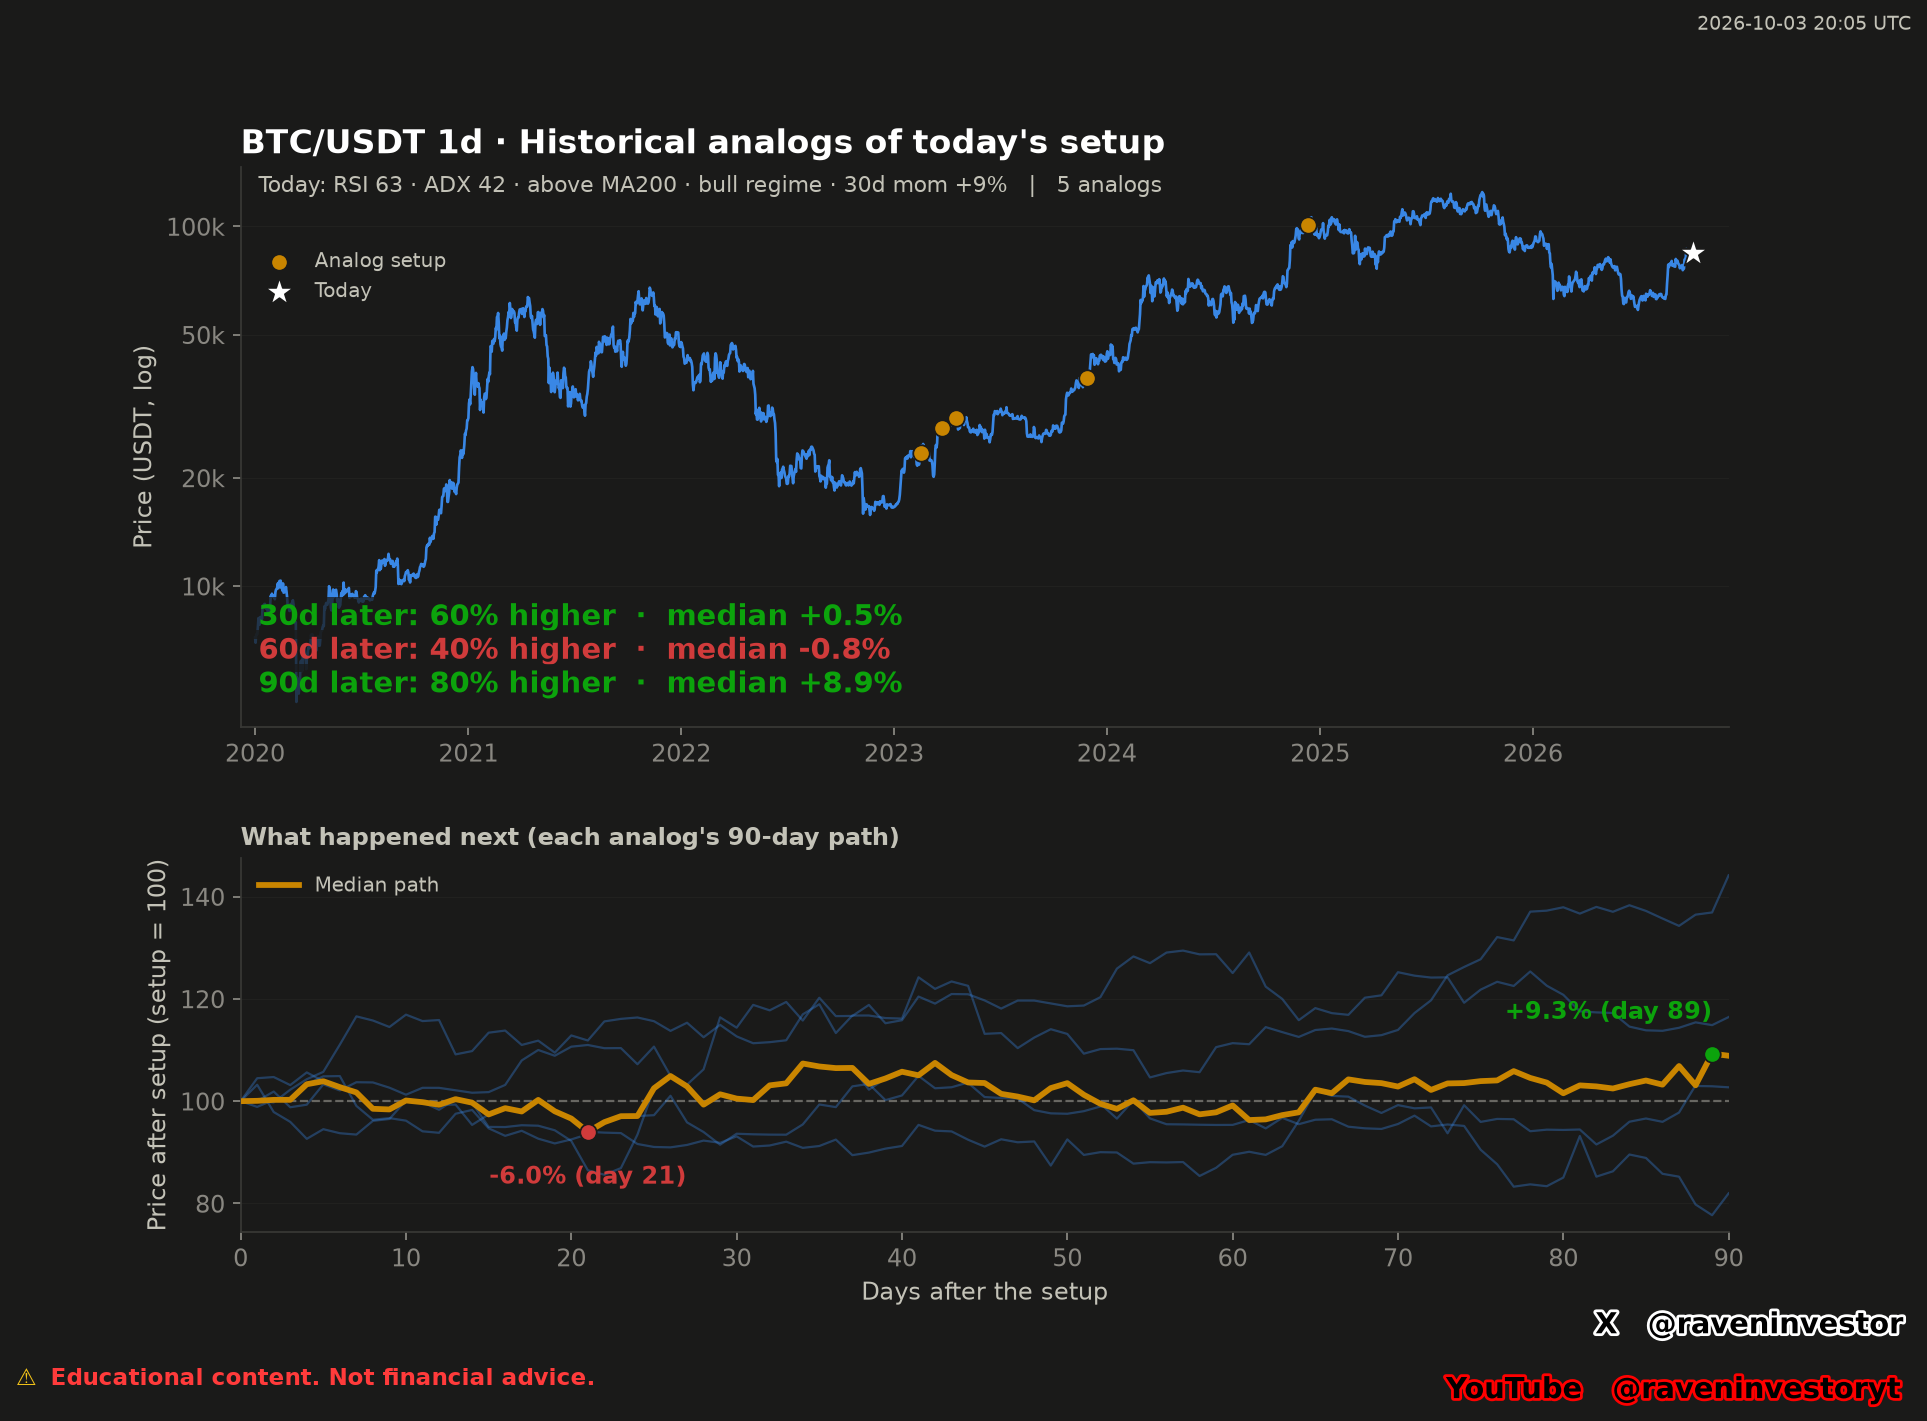
At 30 days, three of those five episodes were higher, a reported 60%, with a median change of +0.5%. At 90 days, four of five were higher, a reported 80%, with a median of +8.9%. Both percentages describe what happened in this selected sample. Neither is a probability assigned to the current market.
How to read both panels
The upper panel places the five orange analog markers on the BTC/USDT daily price history and marks the current setup with a white star. Its price axis is logarithmic. The markers locate qualifying historical setups; they do not mark recommended entries. The chart rounds ADX to 42 and momentum to +9%, while the report supplies 41.6 and +9.3%.
The lower panel resets each of the five episodes to 100 at its anchor and follows the next 90 days. The thin blue lines retain the differences between cases; the thicker orange line is the median path. That shared starting point makes the paths comparable without treating their original prices as equal.
For this five-episode sample, the median path is annotated at -6.0% on day 21 and +9.3% on day 89. These are labels on the median path, not the worst and best outcomes of individual episodes. The day-89 annotation is also distinct from the +8.9% median reported at day 90.
The image adds a 60-day summary for the five analogs: 40% were higher and the median was -0.8%. The supplied TXT does not list individual 60-day returns, so that figure is attributed to the image and no missing episode values are reconstructed. The median at one horizon should not be substituted for the median at another.
Historical comparison: all five episodes
The table transcribes the report’s five anchor dates and the supplied price changes at 7, 30 and 90 days. Dates are UTC candle-opening labels. These are historical price changes, not net strategy returns: no execution rules or trading costs are supplied.
| Anchor date (UTC) | After 7 days | After 30 days | After 90 days |
|---|---|---|---|
| 2023-02-16 | +1.7% | +14.4% | +16.4% |
| 2023-03-24 | +3.7% | +0.5% | +8.9% |
| 2023-04-17 | -6.5% | -6.9% | +2.7% |
| 2023-11-28 | +16.6% | +12.7% | +44.2% |
| 2024-12-11 | -0.9% | -6.4% | -18.0% |
Across the five episodes, the 7-day summary reports three higher outcomes (60%), a +1.7% median and a +2.9% mean, with results from -6.5% to +16.6%. At 30 days, the same five-episode sample has a +0.5% median and a +2.9% mean, with results from -6.9% to +14.4%.
At 90 days, the five-episode sample has a +8.9% median and a +10.8% mean, spanning -18.0% to +44.2%. The November 28, 2023 anchor supplies the largest listed 90-day gain; December 11, 2024 supplies the negative 90-day outcome. The April 17, 2023 case is negative at 7 and 30 days but positive at 90 days. The complete table matters because a positive median conceals these different paths.
Our interpretation is that horizon and dispersion are more informative here than a single headline success rate. The five selected episodes do not support one inevitable trajectory. Historical similarity does not guarantee the same future outcome.
How the analogs were selected
The declared source is Binance USD(S)-M BTCUSDT perpetual-futures aggTrades. Our own system constructs candles through aggTrades → 1 second → 1 minute → 4 hours / 1 day / 1 week. The report states that 3,386,930,944 aggTrades were processed and that the daily study covers 2,467 complete market days, from January 1, 2020 through October 2, 2026.
The matching fingerprint combines RSI(14), ADX(14), the side of MA200, the regime defined by MA50 versus MA200, 30-day momentum and position within a range. The side of MA200 and the regime must match exactly. Other features use indicator-specific tolerances. Recent days are excluded to avoid comparing the setup with itself; nearby matches are grouped into episodes before later price changes are reviewed.
The summary does not disclose the numerical tolerances, exclusion length, episode-grouping gap or range lookback. It also does not provide the complete indicator implementation or anchor-selection rule. The source archive and described workflow make provenance clearer, but this summary alone is insufficient to reproduce the exact search independently.
The frozen cutoff is October 2, 2026. The report and chart were generated October 3, 2026 at 20:05 UTC. The chart’s word “Today” refers to that supplied snapshot, not a live reading. No new financial calculations were performed for this article.
What this comparison can support—and its limits
This five-episode study can support a review of specific historical cases under one matching method. It shows why inspecting individual outcomes matters alongside the median. It does not establish predictive accuracy, a causal link between the indicators and later price changes, or a profitable trading rule.
The sample is small and selected by the model’s features and tolerances. Different matching choices can produce different analogs. History starts in 2020 and excludes earlier Bitcoin cycles. Grouped episodes should not be presented as a large or fully independent statistical sample.
No exact current price, MA200 value, support or resistance is supplied, so this article does not infer numerical trading levels from the chart axis. The supported conclusion remains descriptive: five past episodes shared the selected characteristics, but their subsequent outcomes differed.
Sources and data fingerprint
Sources: the supplied RavenInvestor report and chart, generated October 3, 2026 at 20:05 UTC; underlying archive declared as Binance USD(S)-M BTCUSDT daily aggTrades. This article does not independently reprocess that archive. View the Binance archive.
Data fingerprint declared by the report: 3b8b30c9ffc2ce72. This identifies the supplied data version; it does not certify the matching method or replace independent verification.