What the supplied chart reports
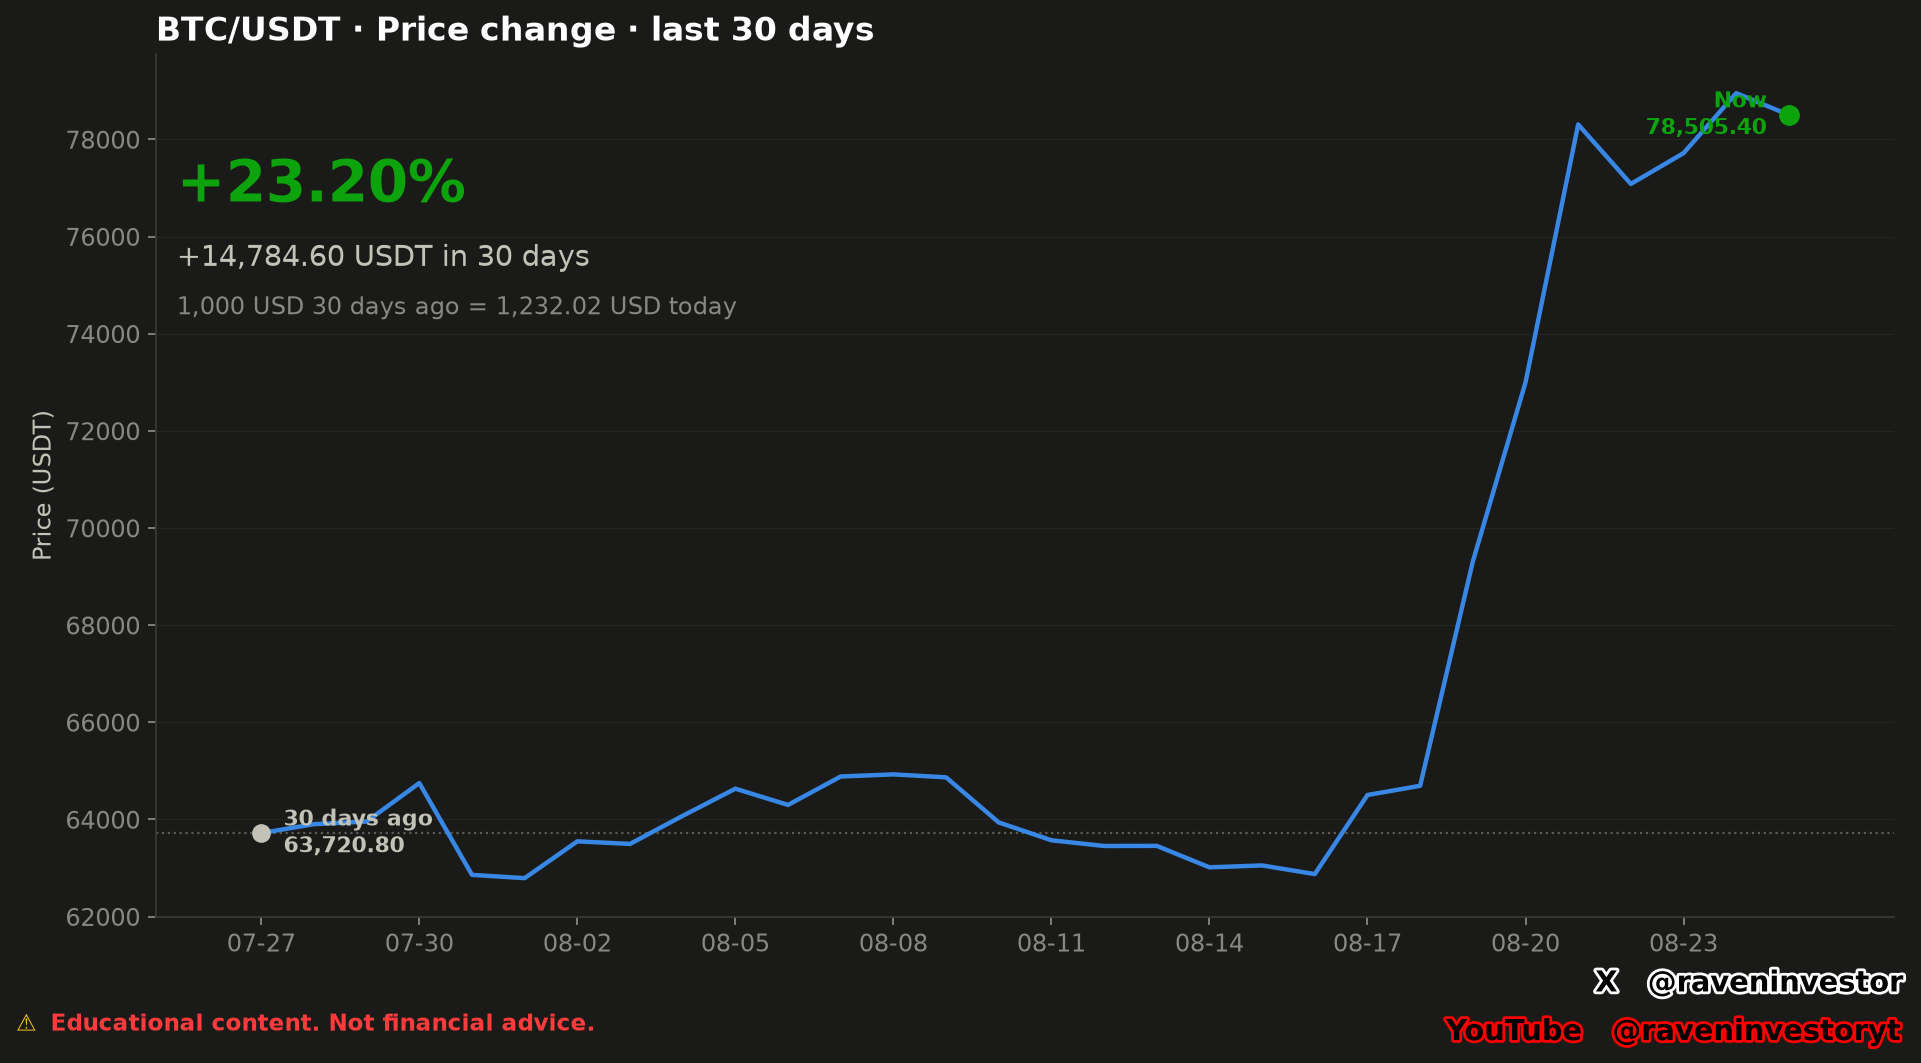
The supplied BTC/USDT image and reconstruction report an initial sample close of 63,720.80 USDT and a final sample close of 78,505.40 USDT. They report an absolute change of +14,784.60 USDT and a percentage change of +23.20%. These figures were not recalculated here. The ending observation is historical, not a current market quote.
The report defines the observations as the closes of the first and last daily candles in its window. They are not presented as the period’s minimum and maximum. A positive difference between them describes the selected endpoints, not the result of a verified trading account.
The 1,000 USD example: equivalence, not verified profit
The image and report express the example in USD: 1,000 USD at the start corresponds to 1,232.02 USD at the end under the supplied price variation. Both amounts are transcribed directly, without recalculating the result from the rounded percentage. This is a hypothetical example scaled by the price change, not an executed investment or verified net profit.
The report excludes fees, spread and taxes from the example. It provides no fills, slippage model or account ledger. Contract prices are denominated in USDT, while USD is retained here as the unit of the published illustration. No USD/USDT exchange rate or conversion model is supplied that would establish it as a dollar-denominated account result.
How to read the 30-day path
The horizontal axis covers the supplied 30-day period, while the vertical axis displays price in USDT. The blue line begins at the labeled 63,720.80 USDT observation. Through much of the first and middle portions, the line moves within a comparatively compact area of the chart, with alternating advances and declines rather than a continuous one-directional path.
Near the right side, around the displayed August 20 marker, the line rises sharply into the upper area of the chart. It then pulls back, advances again and finishes at the green point labeled “Now 78,505.40.” In this historical chart, that is the final sample close. The visual therefore shows that the positive start-to-end result was not distributed evenly across the full window; much of the displayed change appeared late in the sample.
A line chart connects successive observations to make the path legible. It does not show every transaction between those observations. The reconstruction identifies daily candles and a close-to-close comparison, not a record of every intraday move. The plotted shape should be read at that resolution, without filling in missing transaction detail.
Observed result versus interpretation
Observed: the ending label is above the starting label, and the chart reports both a positive USDT change and a positive percentage change for the selected 30-day window. The largest visible upward transition occurs in the later part of the image.
Interpretation: the chart describes positive start-to-end performance and a change in the character of the visible path near the end. It does not identify the cause of that move. No volume, news, order-flow or other explanatory data were supplied, so this analysis does not attribute the change to any external event or market mechanism.
The finishing point also does not establish that the advance will continue. A positive historical change measures what happened between two selected observations; it is not, by itself, a directional signal for the next period.
Comparison within the supplied 30-day window
The valid comparison available here is between the two labeled endpoints and the intervening path shown in the same chart. The sample size is one supplied 30-day window. The chart does not provide a set of earlier 30-day windows, percentile rankings or comparable-event outcomes, so no claim can be made about how unusual the reported change is historically.
Within this one sample, the later segment contributes the most visually prominent change, while the earlier portion contains smaller oscillations around a lower area of the price axis. That contrast describes the supplied path only. Historical similarity does not guarantee the same future outcome, and a different 30-day window can produce a different result and sequence.
Which closes are compared and how change is defined
The reconstruction identifies the Binance USDⓈ-M BTCUSDT perpetual future and its public aggregate-trade archives as the source. RavenInvestor locally builds 1-second candles, then 1-minute candles and finally daily candles. The sample contains 30 daily candles, from July 27 through August 25, 2026, in UTC.
| Observation | Candle opening date (UTC) | Close (USDT) |
|---|---|---|
| First candle in the window | 2026-07-27 | 63,720.80 |
| Last candle in the window | 2026-08-25 | 78,505.40 |
Dates identify each candle’s opening, not the closing instant or a trade execution. The phrase 30-day window refers to the selection of 30 daily candles; the calculation compares the first candle’s close with the last candle’s close, not the first day’s open with the last day’s close. They are the selection’s temporal endpoints, not values defined as the period’s high and low.
Change (%) = (final close − initial close) / initial close × 100. The report states a difference of +14,784.60 USDT and a change of +23.20%. The formula documents the definition used; those results were not recalculated for this article.
The percentage summarizes two closes and does not by itself describe the intervening path. It does not establish a maximum drawdown, volatility measure or net account return. The line supplies visual context, but the report does not attach the complete daily price series to reproduce it or calculate those measures.
Supporting report and verification limits
The document is a later reconstruction anchored to August 25, 2026, not a report preserved since original publication. The initial and final prices, difference, percentage and hypothetical illustration match the labels in the original image, which is retained. The report supplies the source, window and price field used.
The declared 3,386,930,944 aggregate-trade records and 2,451 days describe overall database coverage, not the 30-candle sample. The September 16 frozen cutoff concerns the database used for reconstruction and does not extend this comparison period. The declared fingerprint is 73e1a82e4d3a96a3; its algorithm and included files are unspecified.
The supporting report includes an annual extrapolation that this analysis does not adopt. The document does not detail its formula or annualization convention, so we do not use it as a conclusion or replace it with another calculation. The observed result remains limited to the closes in the supplied window, without an annual projection.
Documented provenance and the fingerprint do not constitute an independent audit. The complete 30 candles and aggregation code are not attached, and we do not claim to have reproduced the results from raw trades. They are presented as declared reconstruction results and observations from the image.
Methodology and risk note
This analysis combines the original chart with the supplied reconstruction. No new financial calculations were performed. The reported percentage depends on the selected initial and final closes; changing the window can change the result. The measure alone does not describe the intervening risk, establish a realized account gain or support extrapolation to another period.
The image provides endpoint observations rather than technical support, resistance or model-generated trigger levels. A “Levels to Watch” section is therefore omitted. The displayed values should not be treated as guaranteed boundaries, and the reported price change does not ensure that Bitcoin will rise or fall next.