What the 30-day test reports
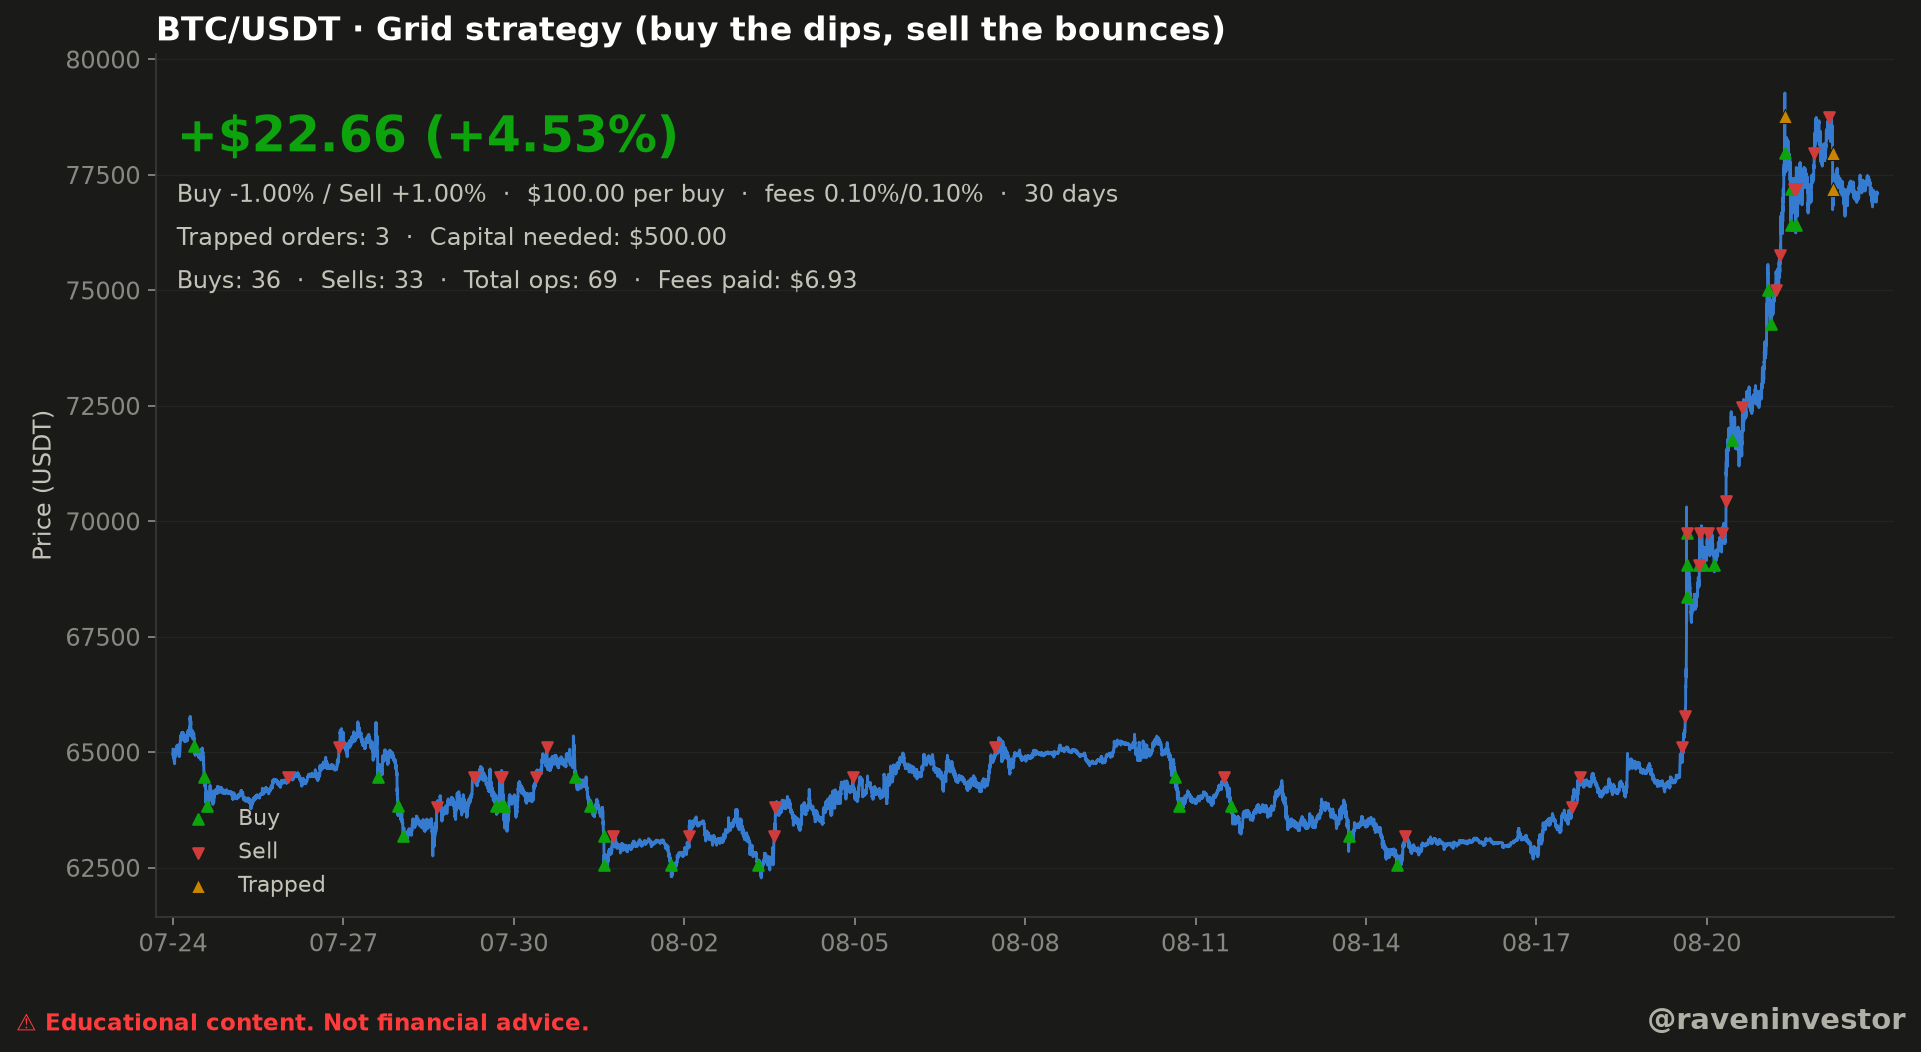
The supplied BTC/USDT chart and reconstruction report describe a historical simulation with a positive result of +22.66 USDT, shown alongside +4.53%. Required capital is reported as 500.00 USDT, with 6.93 USDT in fees. The report denominates these amounts in USDT. They are supplied outputs, not independently recalculated results.
Activity totaled 69 operations: 36 buys and 33 sells. The model labels three orders as trapped. The figures are presented exactly as printed in the supplied chart.
The supplementary report now provides the realized and unrealized breakdown absent from the original image. It confirms that this is a simulation, with no real money or orders placed on an exchange. The total includes positions still unsold, as detailed below.
What makes up the net result
The supplementary report separates completed sales, the valuation of unsold positions and fees. These amounts are transcribed from the report in USDT, not derived through new calculations or visual estimates.
| Component | Amount (USDT) | What it represents |
|---|---|---|
| Gross realized profit | +33.00 | Sales result before fees. |
| Gross unrealized result | −3.41 | Reported valuation result for positions still unsold. |
| Fees paid | −6.93 | Buy and sell costs included by the model. |
| Total net result | +22.66 | Reported total, including the unrealized component. |
The total result is not entirely realized profit: part of the evaluation concerns open positions. Net means after the fees included in this simulation, not after every possible cost of trading a perpetual future; the report excludes financing and funding.
The weight of fees
The report states that fees consumed 21.0% of gross realized profit. That percentage is also taken directly from the document. Reading the components together shows why looking only at the 33.00 USDT gross sales profit would leave out both fees and the result on positions that remained open.
Required capital is not the same as a loss
The 500.00 USDT represents peak simultaneous capital needed, according to the report. The +4.53% is expressed against that amount. It should not automatically be reinterpreted as a return on a fixed initial deposit throughout the period or as an expected future return.
The three orders classified as trapped are purchases that remain unsold, with a reported combined cost of 300.00 USDT. That cost is capital assigned to the positions, not a 300.00 USDT loss or a claim that they cannot be sold. Their reported unrealized result is −3.41 USDT.
The document reports a market-price valuation but does not publish the exact reference price or each lot’s details. We therefore present −3.41 USDT as a declared reconstruction result without claiming to have reproduced its valuation. It is not a quote or a loss calculated for today’s market.
How to read the image
The blue line traces BTC/USDT price across the displayed 30-day window. Green upward triangles represent buys, red downward triangles represent sells, and amber upward triangles represent orders classified as trapped by the model. Those meanings come directly from the chart legend.
Buy and sell markers alternate repeatedly through much of the earlier, lower section of the price path. Near the right edge, price advances sharply and a denser sequence of markers appears across the move and the higher region that follows. The three amber markers are visible in that later area.
This pattern shows when the supplied rules recorded actions; it does not establish why price moved. The image shows an association between the rule set and the marked operations, not a causal explanation for the market advance.
Parameters supplied with the test
| Parameter | Supplied value | Role in this output |
|---|---|---|
| Buy trigger | −1.00% | Rule printed for buy actions. |
| Sell trigger | +1.00% | Rule printed for sell actions. |
| Order size | $100.00 per buy | Fixed buy amount as labeled on the original chart. |
| Fees | 0.10% / 0.10% | Buy-side and sell-side rates shown. |
| Test window | 30 days | Length of the displayed sample. |
No grid ceiling, grid floor or individual order prices are labeled. For that reason, this analysis does not create a “Levels to Watch” section or infer missing grid boundaries.
Source, sample and execution rules
The reconstruction identifies the Binance USDⓈ-M BTCUSDT perpetual future and its public aggregate-trade archives as the source. RavenInvestor locally builds 1-second and then 1-minute candles. The simulation and its results are RavenInvestor’s processing, not trades executed on Binance.
The specific window comprises 43,200 one-minute candles, from July 24, 2026 at 00:00 through August 22, 2026 at 23:59 UTC. Each timestamp identifies the candle’s opening. These are the inputs to one 30-day test: its 69 operations are not 69 independent strategy tests.
- The rule buys a fixed amount when price falls by one step and sells each lot one step above. Step sizes and the amount per buy are shown in the parameter table.
- The report describes fixed grid levels anchored to the recent high when there is no position. It does not specify the interval used to define that recent high.
- Each fill is assumed at the exact level price, without slippage, with buy and sell fees applied. There was no real money or order submission to an order book.
No financing or perpetual funding costs are charged. Priority when multiple levels are reached within one candle, latency, rounding and complete reinvestment rules are also unspecified. Futures price data alone does not make this simulation a complete reproduction of execution and costs in a real contract.
Supporting report and verification limits
The document is a later reconstruction anchored to August 22, 2026, not a live-trading record or a report preserved since original publication. The total, percentage, capital, fees and counts match those in the original image, which is retained. The breakdown comes from the supplementary report.
The declared 3,386,930,944 records and 2,451 days refer to overall database coverage, not this sample. The September 16 frozen cutoff concerns the database used for reconstruction; it does not extend the test window. The declared fingerprint is c4d8c18e63bc3182, without a specified algorithm or list of included files. These provenance details do not replace an independent audit or a complete reproducible trade log.
What the result can—and cannot—show
Observation: the model reports a positive total after its included fees, alongside three unsold positions with a negative unrealized result. Interpretation: the completed sales and the remaining exposure must be assessed together. The positive headline does not mean all capital returned to cash or that the remaining positions have no risk.
The test does not demonstrate that the same configuration will be profitable in another period. It supplies no second sample, no alternative parameter set and no benchmark. It therefore cannot establish robustness across different market conditions or attribute the outcome to a single cause. It also cannot establish superiority to holding BTC over the same window. The buy-and-hold guide explains that comparison concept; no benchmark return is inferred here.
No historical comparison is included. The available sample size is one 30-day test output. Historical similarity, even if comparable cases are added later, does not guarantee the same future outcome.
Methodology and risk note
This analysis combines the original image with its later reconstruction report. No new financial calculations were performed. Exact-price fills without slippage are modeling assumptions, not evidence that the same orders could have executed live. Missing lot-level records and execution details prevent exact independent reproduction of the result.
Grid settings are sensitive to the tested market path. Fees, uncompleted orders and movements outside the intended grid can materially affect results. The chart is a model output, not evidence of guaranteed live execution or future performance.