The observed result: a positive endpoint, not a smooth return
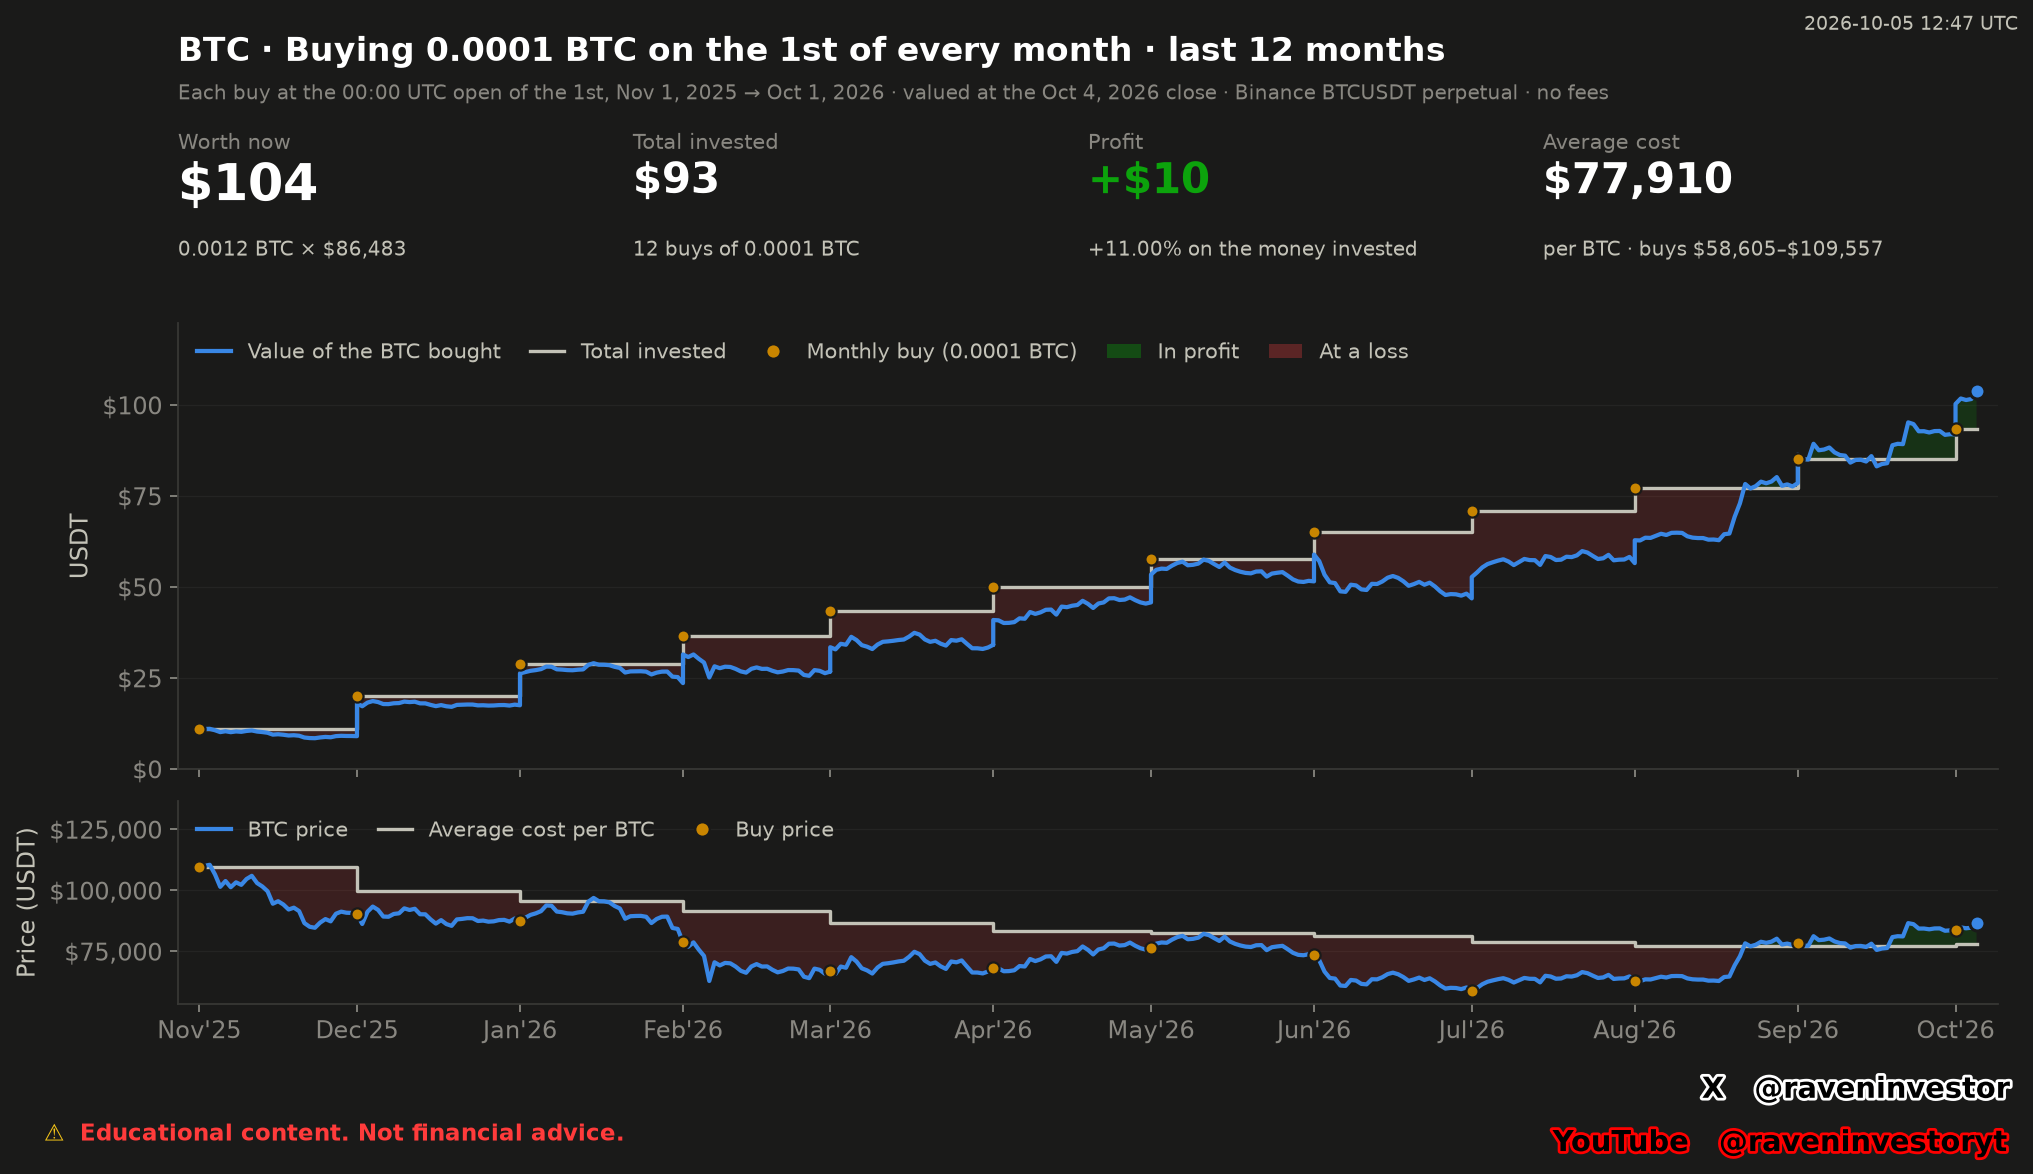
The supplied simulation bought 0.0001 BTC at 00:00 UTC on the first day of each month, from November 1, 2025 through October 1, 2026. At the October 4, 2026 closing reference of 86,482.80 USDT, the accumulated 0.0012 BTC was valued at 103.78 USDT against contributions of 93.49 USDT. The report states a gain of 10.29 USDT, or 11.00%, before costs.
This is a fixed-quantity schedule. It does not invest the same amount of money each month: the reported November purchase cost 10.96 USDT, while July’s cost 5.86 USDT. Calling it a fixed-dollar contribution strategy would change the rule actually tested.
Interpretation: the result describes the relationship between the closing valuation and the cost of BTC accumulated at different prices. It is not evidence that the account earned a positive return throughout the period, nor a claim about the outcome of future monthly purchases.
How to read both panels
In the upper panel, the blue line is the daily value of the BTC accumulated up to that day. The light stepped line is cumulative contributions. Orange dots mark the monthly purchases; green shading means value is above contributions, and red shading means it is below them. A purchase increases both the accumulated BTC and the money committed, so an upward step in portfolio value is not, by itself, an investment gain.
The lower panel separates the BTC price from the portfolio balance. Its blue line is the price series; the light line is average cost per BTC and the orange dots are purchase prices. The final average cost is 77,910.11 USDT per BTC. These are accounting and valuation references, not technical support or resistance levels.
The summary cards round the final value to $104, contributions to $93 and profit to +$10. The report supplies 103.78, 93.49 and +10.29 USDT respectively. Those independently rounded labels should not be subtracted to reconstruct the result. Despite the dollar symbols on the image, the report and chart axes specify USDT; no USD conversion is supplied.
The twelve purchases, with one common valuation date
Every row represents the same 0.0001 BTC quantity. The final column is the report’s price change from that purchase to the October 4 close, not its contribution to the portfolio’s total percentage result. Earlier and later purchases were exposed for different periods. The costs and cumulative totals below are transcribed as reported, not rebuilt by adding rounded rows.
| Purchase date (UTC) | Price per BTC (USDT) | Cost (USDT) | BTC accumulated | Contributions (USDT) | Result at valuation |
|---|---|---|---|---|---|
| 2025-11-01 | 109,557.20 | 10.96 | 0.0001 | 10.96 | -21.06% |
| 2025-12-01 | 90,320.50 | 9.03 | 0.0002 | 19.99 | -4.25% |
| 2026-01-01 | 87,608.30 | 8.76 | 0.0003 | 28.75 | -1.28% |
| 2026-02-01 | 78,706.70 | 7.87 | 0.0004 | 36.62 | +9.88% |
| 2026-03-01 | 66,937.00 | 6.69 | 0.0005 | 43.31 | +29.20% |
| 2026-04-01 | 68,241.40 | 6.82 | 0.0006 | 50.14 | +26.73% |
| 2026-05-01 | 76,305.40 | 7.63 | 0.0007 | 57.77 | +13.34% |
| 2026-06-01 | 73,653.20 | 7.37 | 0.0008 | 65.13 | +17.42% |
| 2026-07-01 | 58,605.40 | 5.86 | 0.0009 | 70.99 | +47.57% |
| 2026-08-01 | 62,859.80 | 6.29 | 0.0010 | 77.28 | +37.58% |
| 2026-09-01 | 78,549.60 | 7.85 | 0.0011 | 85.13 | +10.10% |
| 2026-10-01 | 83,576.80 | 8.36 | 0.0012 | 93.49 | +3.48% |
In this sample of 12 purchases, the report classifies nine as profitable and three as loss-making at the same valuation close. November’s purchase has a reported result of -21.06%, while July’s has +47.57%. The most expensive purchase was November 1 at 109,557.20 USDT per BTC; the cheapest was July 1 at 58,605.40 USDT. These observations describe the supplied ledger, not a rule for choosing future purchase months.
Historical comparison: one window and changing contributions
Across the single 338-candle daily window, the report states that the reference price fell 21.06%, from 109,557.20 USDT at the first purchase to 86,482.80 USDT at valuation. Over the 12 staggered purchases, the reported result was +11.00%. The first figure compares two prices; the second relates the final accumulated position to contributions made on different dates. They do not represent identical cash-flow schedules.
Within the same 338 daily observations, the report identifies September 21, 2026 as the best daily closing percentage result: +11.87%, with value of 95.24 USDT and contributions of 85.13 USDT. Its worst daily close is February 5, 2026: -31.33%, with value of 25.15 USDT against 36.62 USDT contributed. These percentages compare each day’s value with the contributions accumulated then; they are not a reported peak-to-trough drawdown measure.
Interpretation: the positive final reading coexists with a materially negative earlier valuation. The chart therefore adds information that the final gain alone leaves out. The sample is one window containing 12 purchases, not 12 independent strategy tests. Historical similarity does not guarantee the same future outcome, and this comparison does not establish that fixed-BTC purchases generally outperform holding or other contribution schedules.
Methodology and risk
The report was generated October 5, 2026 at 12:47 UTC, with a frozen cutoff at October 4. The study uses 338 daily candles from November 1, 2025 through October 4, 2026. The chart’s twelve-month label refers to the last 12 first-of-month purchase dates with data; it is not twelve fully elapsed months after the initial purchase.
The declared source is Binance USD(S)-M BTCUSDT perpetual-futures aggTrades. Our own system constructs candles through aggTrades → 1 second → 1 minute → 4 hours / 1 day / 1 week. The report declares 3,386,930,944 processed aggTrades and 2,469 complete market days for the broader source coverage; those totals are not the sample size of this purchase study.
Under the reported method, purchase cost is quantity multiplied by the opening price; daily value is accumulated BTC multiplied by the daily close; average cost is total contributions divided by accumulated BTC. This article transcribes the supplied outputs and performs no new financial calculations. The 11.00% is the reported result on contributed money, not an annualized return.
There were no real orders. Commissions, spread and slippage are excluded. The report warns that perpetual prices can differ from spot prices and that a different purchase time or valuation day changes the outcome. The simulation does not document margin, leverage, funding or contract execution, so it must not be read as the realized performance of a traded perpetual position or as evidence of BTC owned in a wallet.
Sources and data fingerprint
Sources: supplied RavenInvestor report and original chart, October 5, 2026, 12:47 UTC; underlying Binance USD(S)-M BTCUSDT perpetual aggregate-trade archives. The source records were not independently reprocessed for this article. Binance public archives.
Data fingerprint declared by the report: 2f688fa03b976405. Identifies the supplied version; it is not proof of real trades or an independent audit.