What the supplied chart reports
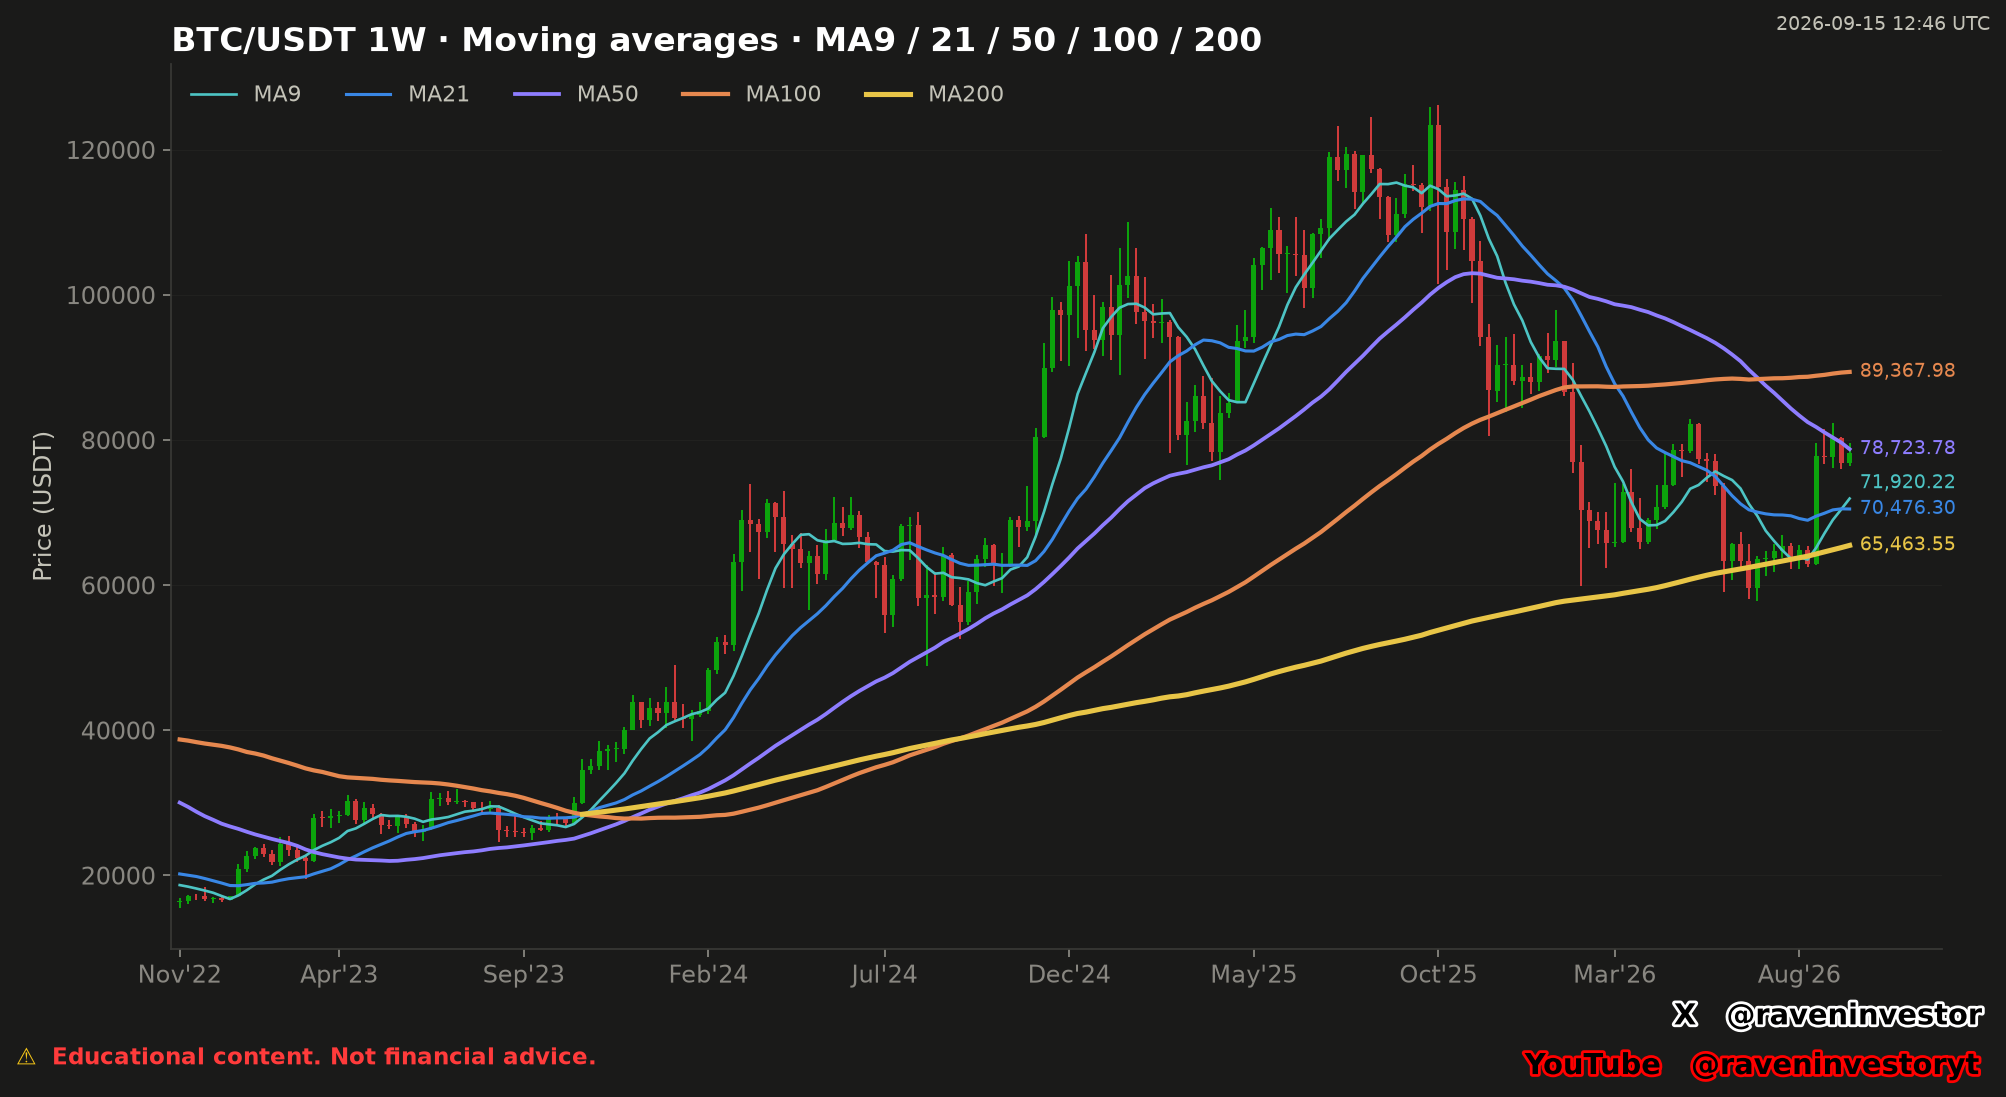
Observed: the chart displays five moving-average values on BTC/USDT 1-week candles. At the timestamp, the MA100 is $89,367.98, the highest printed average, followed by MA50 at $78,723.78. The faster pair is MA9 at $71,920.22 and MA21 at $70,476.30. MA200 at $65,463.55 is the lowest printed average.
The MA9 is above the MA21 in the supplied snapshot. Both are below MA50 and MA100, while both remain above MA200. This is an ordering of the five displayed calculations at one timestamp. It does not establish why the lines reached these values or what price will do next.
The recent candles are shown near the right edge, but the image does not print an exact current-price value. For that reason, this analysis does not state whether the latest price is numerically above or below any moving average and does not calculate price-to-average distances.
How to read the five weekly lines
The teal MA9 and blue MA21 represent the shortest displayed windows. The purple MA50 and orange MA100 incorporate successively more weekly observations, while the yellow MA200 uses the longest labeled window. The chart lets readers compare their level, slope and order on the same weekly price history.
In this image, MA9 turns upward near the right edge and finishes above MA21. MA21 also bends upward. MA50 slopes downward into its printed value, MA100 remains the highest displayed line, and MA200 slopes upward into the lowest displayed value. These statements describe the visible lines only; they are not directional forecasts.
The chart labels each series “MA” but does not identify whether the calculation is simple, exponential or another form. It also does not name the input price field. The educational guide explains a simple close-based calculation as a transparent example, not as a claim about the undisclosed implementation behind this image.
Levels to Watch
The five printed averages provide moving references for later weekly observations: $89,367.98 (MA100), $78,723.78 (MA50), $71,920.22 (MA9), $70,476.30 (MA21) and $65,463.55 (MA200).
“Watch” means compare future supplied values and price observations with these timestamped references. A moving average changes when a new input enters its window. These numbers are therefore not fixed support or resistance levels, and the chart does not predict that price will reach, hold or cross any of them.
Historical comparison: one 1,400-day chart window
The historical sample is one BTC/USDT window identified as 1,400 days in the supplied filename, displayed with 1-week candles. The chart shows five moving-average paths within that one window. It is not a sample of independent market cycles or matched historical analogs, and the exact number of accepted weekly observations was not supplied.
Within this single sample, the slower lines preserve a visibly broader path while the shorter lines change direction more frequently. That comparison is descriptive. Historical similarity does not guarantee the same future outcome, and another window or calculation setting could produce a different arrangement.
Interpretation and limits
Interpretation: the chart presents a divided weekly structure. The short MA9–MA21 pair sits between the lower MA200 and the higher MA50–MA100 pair. This gives a compact way to track whether the separation, ordering and slopes persist or change in later data.
The values alone do not identify market cause, probability or trade quality. A line crossing price or another average would record a changed relationship, not prove that a trend must begin or continue. Weekly averaging can also conceal shorter movements and can react after a rapid price change.
Methodology and risk note
This article transcribes and interprets only the supplied RavenInvestor image timestamped September 15, 2026 at 12:46 UTC. It uses the chart’s BTC/USDT market, 1-week timeframe, five printed moving-average values and the 1,400-day identifier in the supplied filename. No new financial calculations were performed.
The venue, market-data provider, average type, input price field, timezone used to close weekly candles, treatment of the unfinished week and complete calculation rules were not supplied. The chart cannot be reproduced exactly from the image alone.