What the supplied model reports
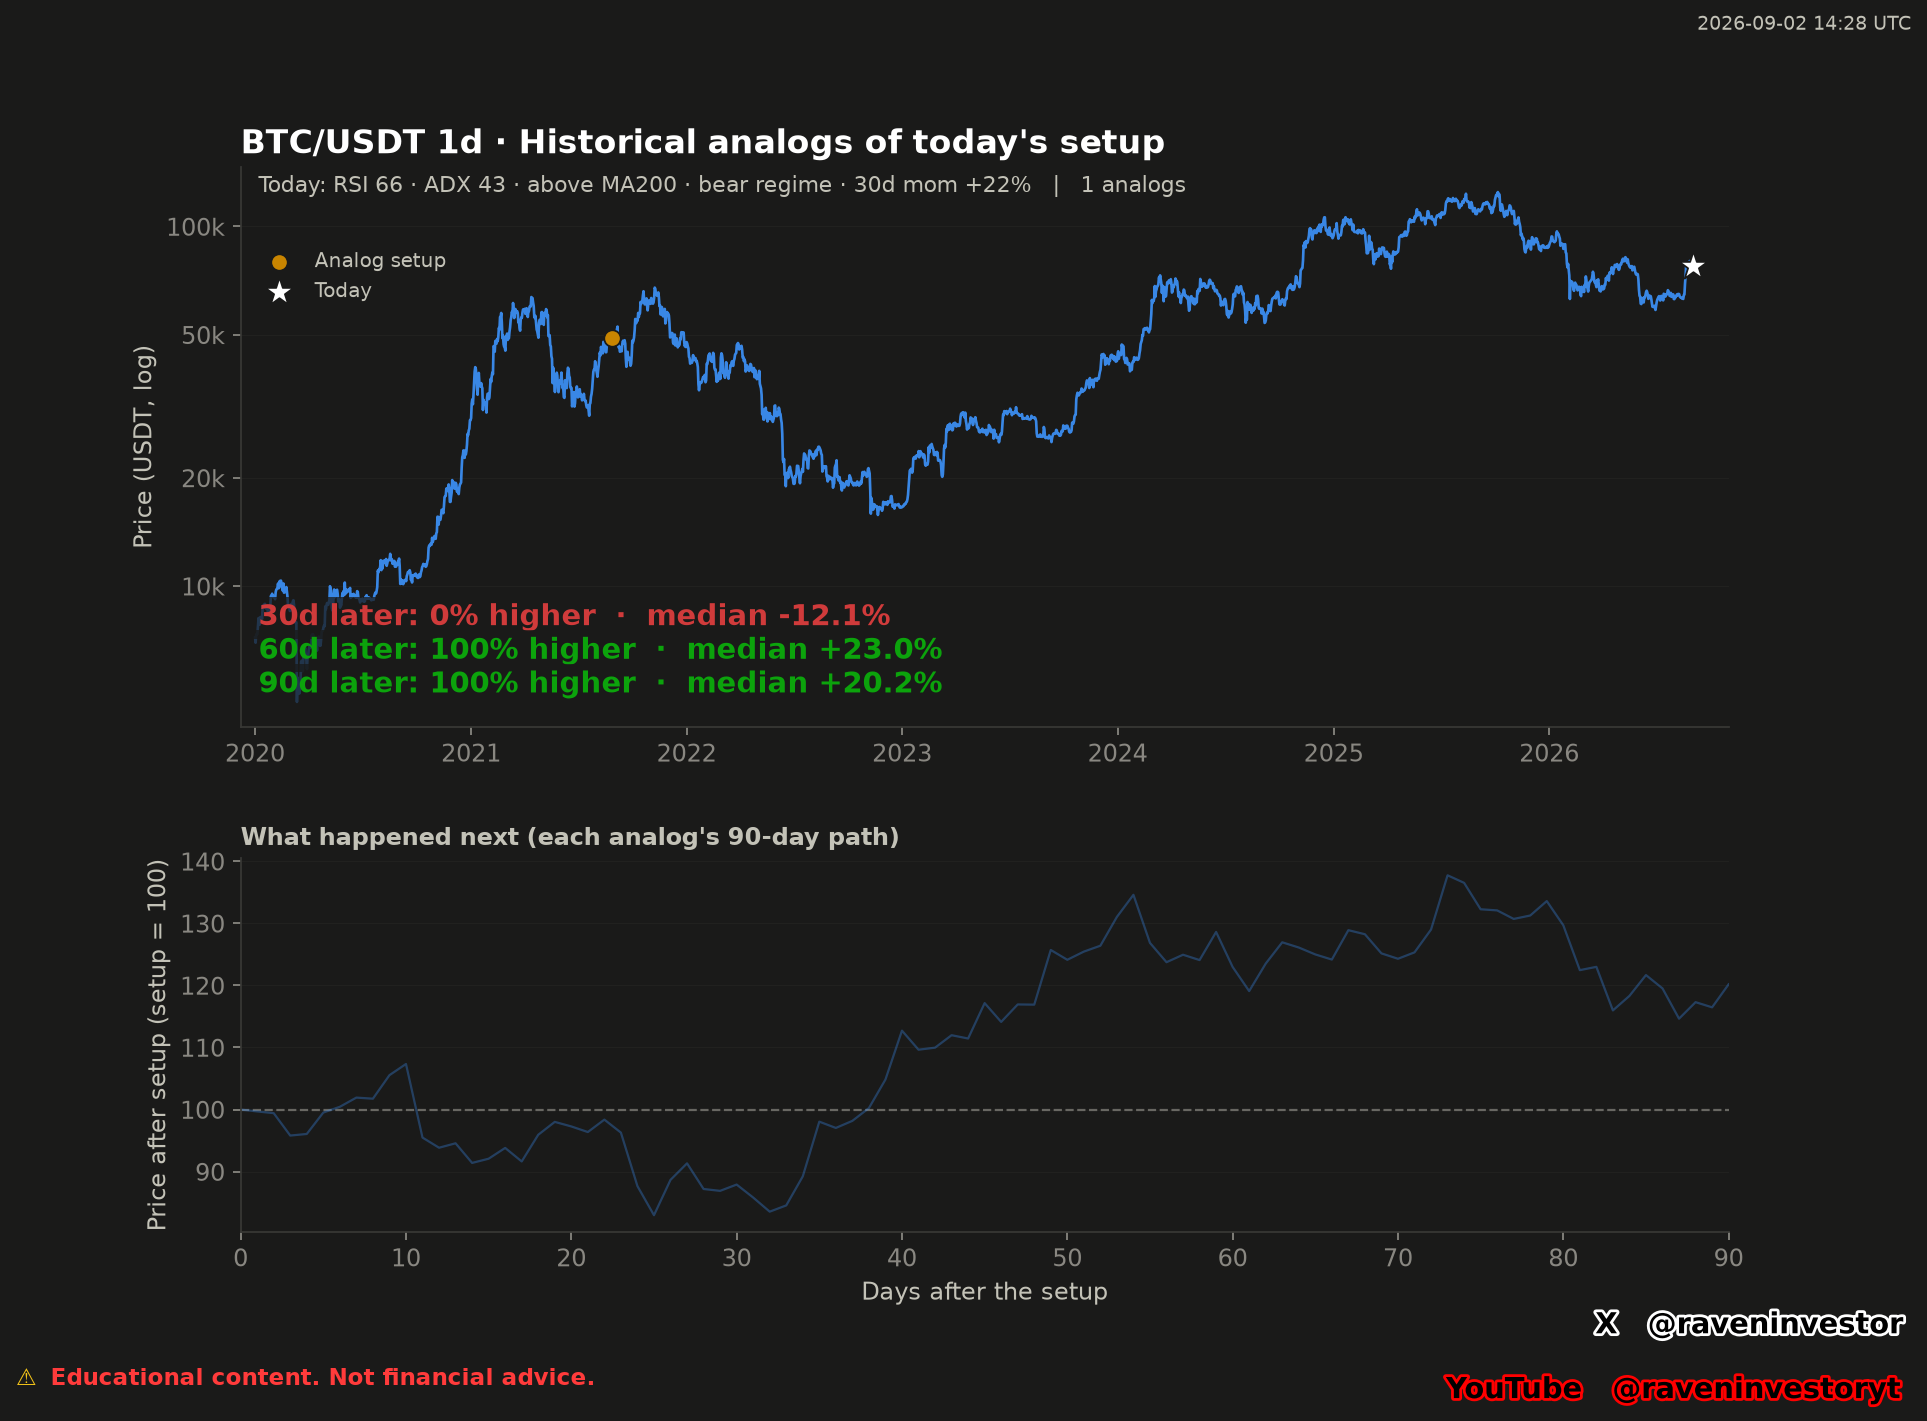
Observed: the original chart describes the BTC/USDT daily setup with RSI at 66, ADX at 43, price above MA200, a bear regime label and 30-day momentum of +22%. Its historical search returns one analog.
For that one historical match, the chart reports 0% higher after 30 days with a median return of −12.1%. At 60 days it reports 100% higherand a median of +23.0%. At 90 days it reports100% higher and a median of +20.2%. These values are transcribed from the image and were not independently recalculated.
The sample size changes how those percentages must be read. With only one analog, each “higher” percentage summarizes the outcome of that sole historical observation. It does not estimate a stable frequency across a broad set of comparable cases.
The dated setup compared by the model
The reconstruction report anchors the setup to September 1, 2026. It is not a live market reading. The original chart’s September 2, 2026 at 14:28 UTC timestamp identifies the chart output and should not be confused with the date of the data being compared.
| Feature | Value or condition |
|---|---|
| RSI(14) | 65.7 |
| ADX(14) | 43.2 |
| Price relative to MA200 | Above |
| Regime based on MA50 versus MA200 | Bear |
| 30-day momentum | +21.8% |
| Position in the range | 0.79 |
Decimal readings are transcribed from the report; the integer RSI, ADX and momentum labels remain in the original image. No new financial calculations were performed. The document does not specify the formula or lookback for position in the range: 0.79 is retained as reported, without converting it to a percentage or assigning an undocumented interpretation.
Two matching days, one historical episode
The search reports 2 matching days grouped into 1 episode, anchored to August 27, 2021. That grouping explains why the chart shows one analog. The two days are not presented as independent cases; the window’s 2,436 candles do not represent 2,436 analogs either.
| Horizon | Reported change | Episodes with a higher price |
|---|---|---|
| 7 days | +1.9% | 1 of 1 |
| 30 days | −12.1% | 0 of 1 |
| 90 days | +20.2% | 1 of 1 |
The 60-day result belongs to the original image: it shows +23.0% and 100% higher, based on one analog. The report mentions that horizon in its methodology but provides no corresponding result in its table or summaries. The chart figure is retained without presenting it as confirmed by the document.
In this sole episode, price was higher after 7 days, lower after 30 and higher after 90. The interpretation depends on the horizon: a positive endpoint does not imply an always-positive path or an absence of declines. These are points on one path, not separate trials. The report provides no maximum-drawdown measure to quantify the risk experienced along it.
With one episode, the reported mean, median and range endpoints summarize the same observation. They are not independent confirmations. Likewise, “100%” means the sole observed case rose at that horizon: it is not a success probability applicable to the current setup.
How to read the two panels
The upper panel places BTC/USDT price on a logarithmic scale. An orange circle marks the single prior analog setup and a white star marks the setup being examined. Their separation in calendar time shows that the model is matching a defined configuration rather than claiming that the surrounding price paths are identical.
The reconstruction identifies August 27, 2021 as the episode’s anchor date; the image itself does not label that date. Neither source supplies an exact anchor price or current price. The report distinguishes exact categorical matches from tolerated numerical differences, but does not supply the tolerance values.
The lower panel rebases the historical setup to 100and traces its next 90 days. The dashed 100 line is the setup baseline: values below it represent a lower price than at the historical setup, and values above it represent a higher price. The displayed path moves on both sides of that baseline before the supplied 30-, 60- and 90-day summaries.
Historical comparison: one analog
The valid historical comparison sample is one. The chart presents that observation across three forward horizons: 30, 60 and 90 days. The first horizon is negative under the supplied summary, while the later two are positive. This describes one path changing through time, not three independent historical matches.
A sample of one cannot show dispersion between analogs, reveal how often different outcomes occurred, or establish whether the result is robust to small changes in the matching rule. The median labels also summarize only the one included observation.
Historical similarity does not guarantee the same future outcome. The current setup may follow a different path even if the supplied model judged its selected inputs sufficiently similar to the earlier case.
What the setup can—and cannot—support
Interpretation: the result identifies one episode under the model's partly documented criteria and provides one case for conditional review. It can help an analyst inspect how a similarly classified observation evolved, which parts of the path differed by horizon, and which assumptions require stress testing.
RSI, ADX and MA200 describe different parts of the setup. RSI 66 is the supplied momentum reading; ADX 43 is the supplied trend- strength reading; and “above MA200” is the supplied price-to- average condition. None of those inputs alone establishes the direction of the next move.
The chart simultaneously states “above MA200” and “bear regime.” The report now identifies the regime input as MA50 versus MA200, while the first condition compares price with MA200. They are different comparisons, so the labels are not inherently contradictory. The numerical moving averages and complete classification rule are not supplied, however; we cannot independently validate that label from this report alone.
No support, resistance, target, liquidation zone or exact current price was supplied. A “Levels to Watch” section is therefore omitted rather than inferred from the chart axis.
Source, window and matching rules
The declared source is the Binance USDⓈ-M BTCUSDT perpetual future, through its public aggregate-trade archives. RavenInvestor locally constructs one-second, one-minute and daily candles. The stated window spans January 1, 2020 through September 1, 2026, in UTC, with 2,436 daily candles, referenced by their opening.
The comparison fingerprint combines RSI(14), ADX(14), the side of MA200, regime based on MA50 versus MA200, 30-day momentum and position in the range. Indicator-specific calibrated tolerances are allowed, while the MA200 side and regime must match exactly as categories. This does not mean prices or numerical moving-average values must be identical.
The report states that the most recent days are excluded to avoid self-comparison and nearby matches are grouped into episodes. It does not publish the tolerances, number of excluded days, separation defining an episode or rule for choosing its anchor. It also does not clarify when parameters were calibrated or how candidates without complete follow-up are handled. Those details are needed to repeat the exact selection and assess its sensitivity.
Supporting report and verification scope
The supporting report is a later reconstruction anchored to September 1, 2026, not a report preserved since original publication. It complements the image with the data source, indicator periods, grouping and episode anchor date. It is retained as internal documentation; it is not an independent audit.
The 3,386,930,944 aggregate-trade records and 2,451 complete days describe the overall coverage of the reconstructed database, frozen at September 16. They do not extend the analysis window or the one-episode sample. The declared fingerprint is 9b562520d89a3659; its algorithm and covered files are unspecified.
The daily series, indicator values for every candidate and selection code are not attached. Price fields, RSI and ADX smoothing, missing-data handling and the formulas for momentum and range position are also unspecified. The report improves traceability, but does not by itself allow full reproduction of the search, and we do not claim to have done so.
Methodology and risk note
This analysis distinguishes the original RavenInvestor image timestamped September 2, 2026 at 14:28 UTC from the later reconstruction anchored to September 1. It covers BTC/USDT on a daily timeframe and a sample of one historical episode. No new financial calculations were performed.
The report’s 7-, 30- and 90-day outcomes are separated from the image-only 60-day result. The history starts in 2020 and does not cover earlier Bitcoin cycles. Alternative indicator choices, tolerances or episode rules have not been tested in the supplied material, so no robustness or predictive-accuracy claim is made.
The chart reports association under one matching method; it does not show that the selected indicators caused the later return. It also does not predict that Bitcoin will definitely rise or fall at any of the displayed horizons.