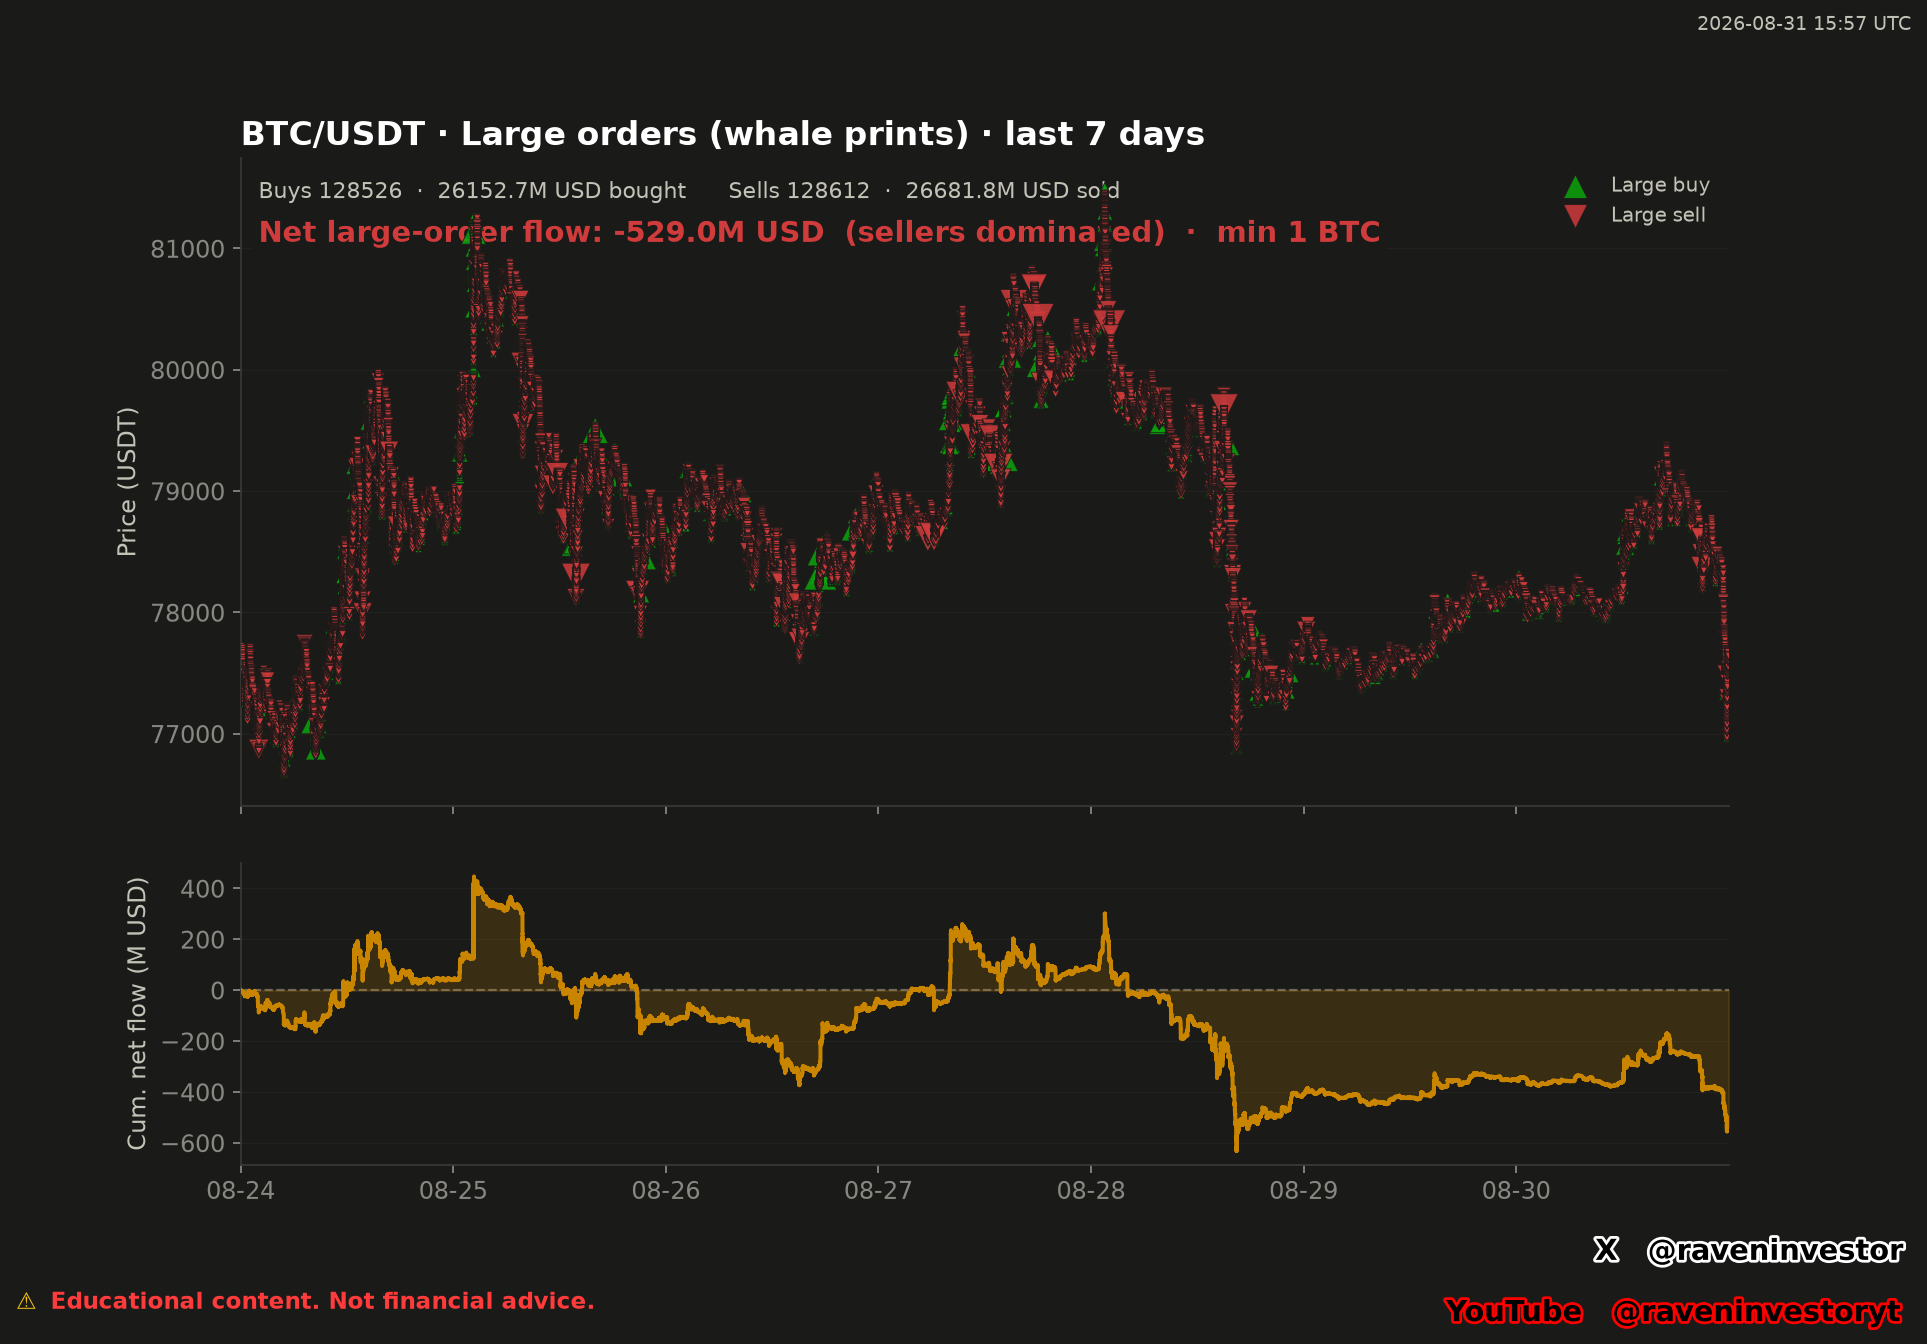
What the supplied seven-day chart reports
Observed: the image reports 128,526 large buys representing 26,152.7M USD bought and 128,612 large sells representing 26,681.8M USD sold. Its headline result is -529.0M USD in net large-order flow and the label “sellers dominated.”
The displayed minimum is 1 BTC. That is the only supplied size rule. The reported counts, values and net flow agree with the reconstruction report; they were not independently recalculated or completed from missing records.
How to read the image
The upper panel places the BTC/USDT price path behind two types of markers. Green upward triangles are labeled large buys, while red downward triangles are labeled large sells. Their dense distribution indicates that the displayed threshold was met repeatedly throughout the seven-day window, not only at one isolated price point.
The lower panel shows cumulative net flow in millions of US dollars. The line moves above and below the zero reference during the sample. It turns decisively negative in the later portion and ends at the published -529.0M USDreading. That endpoint summarizes the chart's classified large-buy and large-sell flow across this one window.
Price and cumulative flow do not move in a fixed one-to-one relationship in the picture. Periods of positive flow, negative flow, rising price and falling price appear at different points. The image therefore supports a description of simultaneous observations, not a claim that the classified prints caused a particular price move.
The five largest reported prints by value
The report documents 257,138 classified large operations in one seven-day window. Within that sample, it lists the following five prints by value, not by date. Sizes, amounts and prices are transcribed at the published precision, without calculating new values.
| Date and time UTC | Aggressive side | BTC | Value (million USD) | Price (USD, report) |
|---|---|---|---|---|
| 2026-08-27 13:55 | Buy | 405.9 | 32.2 | 79,298.00 |
| 2026-08-28 02:02 | Sell | 389.7 | 31.3 | 80,358.00 |
| 2026-08-26 17:27 | Buy | 383.5 | 30.0 | 78,320.00 |
| 2026-08-27 18:00 | Sell | 356.2 | 28.6 | 80,415.00 |
| 2026-08-26 17:40 | Buy | 331.0 | 26.0 | 78,510.00 |
The largest reported individual print was a 405.9 BTC buy worth 32.2 million USD on August 27, 2026 at 13:55 UTC, at a reported price of 79,298.00 USD. It coexisted with a sell-side net balance at the sample endpoint: the direction of the largest print and the balance of all classified operations are different measures.
The table does not identify five whales or establish that the prints belong to different participants. It also does not attribute subsequent price changes to them: no outcome study following each print was supplied.
What seller-dominated large-order flow means here
Interpretation: under the chart's own classification and 1 BTC minimum, the reported cumulative balance finished on the sell side. This describes the net result of the supplied large-order categories. It does not mean that the entire market lacked buyers: every completed trade has counterparties, while a flow model assigns direction according to its own classification rule. The report specifies the aggressive side, rather than a count of distinct people. Its largest reported print was a buy, so the negative total should not be read as uniformly selling large-participant activity.
The “whale prints” wording should also be read narrowly. A large print can be consistent with large-participant activity, but size alone does not identify a wallet, account, institution or beneficial owner. One participant may split activity across many prints, and multiple participants may produce prints above the same threshold. The supplied image contains no identity or entity-attribution data.
Large-order monitoring can still be useful for locating where substantial classified activity clustered, comparing buy-side and sell-side aggregates, and tracking whether cumulative flow changed during a selected window. Those uses add context; they do not establish causality, direction for the next move or a complete view of liquidity.
No support, resistance, target or liquidation level was supplied, so there is no “Levels to Watch” section. No separate comparable historical sample or subsequent outcome was supplied, so a valid historical comparison cannot be presented. Historical similarity would not guarantee the same future outcome even if a later window appeared visually similar.
Source, window and flow classification
The declared source is the Binance USDⓈ-M BTCUSDT perpetual future, through its public aggregate-trade archives, aggTrades. The window runs from August 24, 2026 at 00:00 UTC through August 30, 2026 at 23:59 UTC. The data concern that contract and market, not all Bitcoin trading across platforms.
The report assigns the aggressive side: the party crossing the spread against the order book. It defines net flow as aggressive-buy value minus aggressive-sell value. A negative balance describes the monetary balance of those categories, not the number of unique buyers or sellers, or a withdrawal of money from the exchange.
The 1 BTC minimum comes from the original image. This supporting report does not specify the numerical threshold or its exact boundary treatment: it only mentions a calibrated threshold. Although the published counts, values and net flow match, that agreement does not independently verify the run configuration. Results from the earlier report with a different filter are not carried into this article.
The document uses the phrase ‘without aggregation’, but identifies aggTrades records as its source, which are already aggregate trades. That wording does not establish that each record is an unaggregated execution or a distinct original order. It also does not detail whether any additional grouping occurs. We therefore treat the count as classified operations, not original orders or verified identities.
The report’s USD labels are retained for the table’s values and prices. The chart labels its price axis in USDT; no USD–USDT conversion procedure is supplied, and no conversion or monetary equivalence is calculated or assumed here. Values are presented at their published precision, without reconstructing a balance from rounded totals.
The original chart’s August 31, 2026 at 15:57 UTC timestamp does not extend the window beyond August 30. The study classifies executed activity by its aggressive side; it does not provide an inventory of resting passive orders, OTC transactions or activity outside that exchange. A size filter may miss activity split into records below the threshold.
Supporting report and verification limits
The supporting report is a later reconstruction anchored to August 30, 2026, not a report preserved since original publication. Its main figures match the image’s labels: buy and sell counts, values and net flow. That agreement documents the published results, but does not replace a reproduction from raw data.
The 3,386,930,944 aggregate-trade records and 2,451 days describe the declared overall database coverage, not the size of this seven-day sample. The September 16 frozen cutoff belongs to the reconstruction database and does not extend the analyzed period. The declared fingerprint is e8adc10c8563fc6e; its algorithm and included files are unspecified.
The full trade ledger and code that produced this reconstruction are not attached. Identifiers for the highlighted prints, deduplication, handling of missing data or partial fills, and the specific field used to assign the aggressive side are also undocumented. The report is not an independent audit, and we do not claim to have reproduced its calculations.
Methodology and risk note
This analysis combines the original image with the supplied reconstruction report, separating observations from interpretation. No new financial calculations were performed. The sample is one seven-day window; the classified-operation count is not a count of unique whales or independent historical tests. Unresolved implementation details limit reproducibility.
The reported negative flow is historical and sample-specific. It does not predict that Bitcoin will rise or fall, and it should not be treated as proof of coordinated whale behavior.