Latest model output
Latest BTC/USDT support and resistance
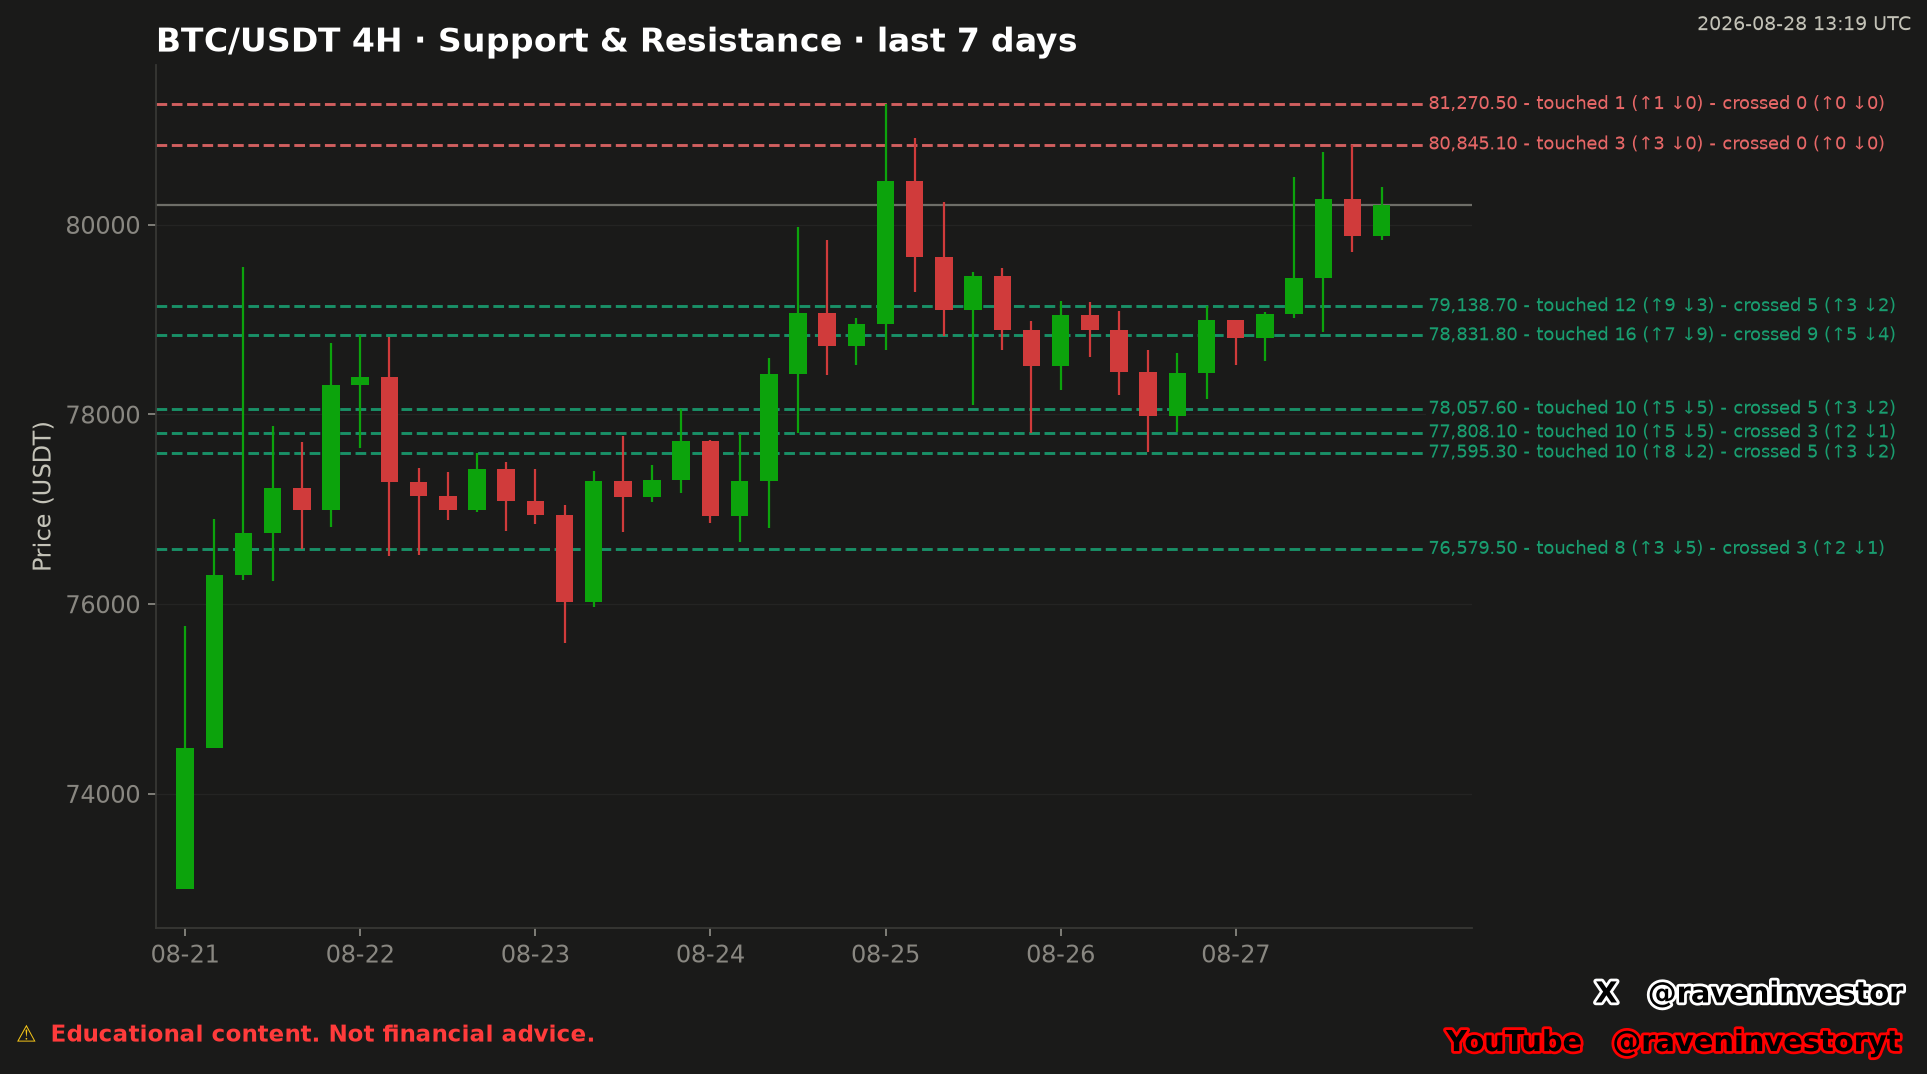
The most recently published RavenInvestor level chart. It changes when a new image is uploaded and is not a real-time market feed.
Reading the chart
What the visual elements represent
- The candlesticks show the price window and timeframe named inside the uploaded chart.
- The dashed horizontal lines are candidate support or resistance levels classified by the model.
- Each label reports the level price and the model's counts for touches, crosses, and their displayed directions.
A larger count records more qualifying interactions under the generating method. It does not prove that a level will hold or break.
Update policy
Latest available, not live
This page displays one fixed image that RavenInvestor replaces when a new model output is available. It does not update between uploads and does not retain earlier versions.
The server file time reports when the image changed on the host. The exact analytical cutoff is the timestamp printed inside the chart when that information is present.
Risk note
Market levels are conditional references
The chart is general educational information. It does not guarantee that Bitcoin will rise, fall, respect a level, or move through it. It is not personalized financial advice.